PhillipCapital DIFC Research Team

Turbo Structures thumbnail

Turbo Structures

Turbo Structures Introduction In the dynamic world of global investing, wealth generation often requires looking beyond traditional buying and holding strategies. Investors seeking to maximize their market exposure or capitalize on short-term market movements frequently turn to sophisticated financial instruments. One of the most popular tools for achieving this is the “Turbo Structure.” Often known as Turbo Certificates or Turbo Warrants, these instruments offer a way to participate in market trends with magnified potential returns. However, with elevated reward comes elevated risk. In this comprehensive guide, we will explore exactly what Turbo Structures are, how their underlying mechanics work, the different types available, and the critical risks you need to consider before adding them to your portfolio. Table of Contents What Are Turbo Structures in Financial Markets? How Do Turbo Structures Actually Work? What Are the Main Types of Turbo Structures? What Is the Knock-Out Barrier and Why Is It Crucial? What Are the Key Advantages of Trading Turbos? What Are the Primary Risks Associated With Turbo Structures? How Do Turbo Structures Compare to Traditional Options? Conclusion: Key Takeaways for Investors What Are Turbo Structures in Financial Markets? A Turbo Structure is a highly popular type of leveraged derivative instrument that falls under the broader umbrella of structured products. Essentially, it allows an investor to participate disproportionately in the price movements of an underlying asset—such as a specific stock, a major index, a currency pair, or a commodity—without needing to invest the massive amount of capital required to buy that asset directly. Unlike investments that are carefully engineered for full capital protection, Turbos are strictly designed for the high-risk, high-reward spectrum of the market. They are tailored for active traders and seasoned investors who have a strong, high-conviction view on the short-term direction of a specific market. When you trade a Turbo, you are using leverage to amplify your market exposure, meaning even small price movements in the underlying asset can result in significant percentage gains—or substantial losses. How Do Turbo Structures Actually Work? To understand how these instruments function, it is helpful to look at the internal components of structured products. Turbos work by utilizing a built-in financing mechanism provided by the issuing financial institution. When you purchase a Turbo, the issuer effectively funds the vast majority of the underlying asset’s purchase price. This funded portion is known as the “financing level” or the “strike price.” Because the issuer is covering the bulk of the cost, you only have to pay a fraction of the asset’s total overall value to enter the trade. This fractional cost is called the “premium.” This financing arrangement creates the “leverage effect.” Because you are only putting up a small percentage of your own capital, any upward or downward price movement in the underlying asset results in a highly magnified percentage impact on your initial premium. The less you pay upfront compared to the total asset value, the higher your leverage will be. Ready to Diversify Your Portfolio? Explore bespoke investment solutions tailored to your unique risk profile and market outlook. Discover Wealth Management Solutions What Are the Main Types of Turbo Structures? Turbo structures are versatile tools that allow investors to profit from both rising and falling markets. They are generally categorized into a few main types based on market direction and expiration terms: Turbo Long (Bullish) You would purchase a Turbo Long if you anticipate that the price of the underlying asset is going to rise. If the market moves upward as you predicted, the value of your Turbo Long will increase, allowing you to capture leveraged profits from the upward swing. Turbo Short (Bearish) Conversely, you would purchase a Turbo Short if you expect the market to decline. This allows you to profit from falling prices without the complexities of traditional short-selling. As the underlying asset’s price drops, the intrinsic value of your Turbo Short rises. Open-End vs. Closed-End Turbos Turbos can also be classified by their lifespan. A “Closed-End Turbo” has a specific, pre-determined maturity date when the product will automatically settle. An “Open-End Turbo,” however, has no set expiration date. This allows an investor to hold the position open for as long as they wish, provided the market does not move against them and trigger the knock-out barrier. What Is the Knock-Out Barrier and Why Is It Crucial? The single most defining and critical feature of a Turbo Structure is its “knock-out barrier.” This is a strict, predetermined price level set by the issuer at the time the product is launched. If the underlying asset reaches or crosses this exact price at any single moment during the trading session, the Turbo is immediately and permanently terminated—or “knocked out.” In the vast majority of cases, a knock-out event means the product expires worthless, and the investor loses 100% of the premium they paid to enter the trade. This mechanism is the reason why Turbos are universally classified as zero capital protection investments. The knock-out barrier acts as a hard stop-loss; it guarantees that you can never lose more than your initial investment, meaning you will never owe the issuer additional funds. However, it also means that a sudden, temporary spike or dip in the market can close your position permanently, even if the market later moves back in your predicted direction. What Are the Key Advantages of Trading Turbos? For experienced market participants, Turbo Structures offer several distinct advantages over standard equity trading: Capital Efficiency: Because of the powerful leverage effect, you can gain substantial market exposure with a relatively minimal upfront capital outlay. This allows investors to keep their remaining capital free for other opportunities. Transparent Pricing: One of the greatest benefits of a Turbo is its pricing transparency. The price of a Turbo moves almost perfectly in tandem (one-to-one) with the price of the underlying asset. This makes it incredibly straightforward for investors to calculate their potential profits and losses in real-time. Built-in Risk Limit: Unlike some derivatives that can result in endless margin calls, the maximum


Turbo Structures قراءة المزيد »

Interest Rate Parity Thumbnail

Interest Rate Parity

Interest Rate Parity Understanding Interest Rate Parity: A Guide to Currency Concepts The foreign exchange market is driven by an invisible web of economic forces. Among the most powerful of these forces are interest rates. For investors navigating global markets, understanding how central bank policies influence currency valuation is crucial. This is where the concept of Interest Rate Parity comes into play. It acts as the mathematical bridge connecting the interest rates of two distinct nations with the exchange rate of their currencies. Let’s explore the mechanics of this fundamental economic theory and how it impacts global trading strategies. Table of Contents What is Interest Rate Parity (IRP)? How Does Interest Rate Parity Work in Currency Markets? What is the Difference Between Covered and Uncovered Interest Rate Parity? Why is Interest Rate Parity Important for Investors? What Happens When Interest Rate Parity is Broken? Conclusion & Key Takeaways What is Interest Rate Parity (IRP)? Interest Rate Parity (IRP) is a foundational economic theory used in the foreign exchange market. At its core, IRP states that the difference in interest rates between two countries should equal the expected change in exchange rates between their respective currencies. In simpler terms, if you invest your money in a country with higher interest rates, you should not be able to make a guaranteed, risk-free profit compared to investing in a country with lower interest rates. Why? Because the currency of the country with the higher interest rate is expected to depreciate against the currency with the lower interest rate over time. This concept ensures that global markets remain in balance. Without this parity, investors could easily borrow money in a country with low interest rates, exchange it, and invest it in a country with high interest rates to make a guaranteed, risk-free profit. To fully grasp this dynamic, it is helpful to first understand the mechanics of the base currency and quote currency, as these components dictate exactly how exchange rates are quoted, calculated, and impacted by shifting rates. How Does Interest Rate Parity Work in Currency Markets? To understand how Interest Rate Parity works practically, imagine a scenario involving two major economies. Let’s say Country A has an annual interest rate of 5%, while Country B has an interest rate of 2%. Under the rules of Interest Rate Parity, the 3% difference in interest rates will be offset by the currency market. Specifically, Country A’s currency is expected to weaken by 3% against Country B’s currency over the course of the year. This depreciation neutralizes the advantage of the higher interest yield. When you look at the major currency pairs traded heavily on global exchanges, their forward pricing relies strictly on these interest rate differentials. If the exchange rate did not automatically adjust to reflect the difference in interest rates, institutional investors would rapidly exploit the gap—a process known as arbitrage—until the market corrected itself and parity was restored. Ready to Trade Global Currency Pairs? Apply your understanding of interest rates to the real-world forex markets. Explore Forex Trading What is the Difference Between Covered and Uncovered Interest Rate Parity? Interest Rate Parity is generally divided into two distinct categories: Covered and Uncovered. Understanding the difference between the two is vital for proper financial risk management. Covered Interest Rate Parity (CIRP) Covered Interest Rate Parity occurs when forward exchange rates (agreed-upon rates for future currency exchanges) perfectly offset the difference in interest rates between two countries. In this scenario, an investor uses a forward contract to “cover” or hedge against the risk of the exchange rate fluctuating. Because the future exchange rate is locked in from day one, the investor completely eliminates currency risk. The mathematical reality of CIRP means that taking advantage of higher interest rates abroad, while hedging with a forward contract, will yield the exact same return as investing safely domestically. Uncovered Interest Rate Parity (UIRP) Uncovered Interest Rate Parity operates on the same basic principle but without the safety net of a forward contract. Here, the investor does not “cover” their position. Instead, they rely purely on the expected future spot exchange rate. UIRP assumes that the currency with the higher interest rate will naturally depreciate by the exact amount of the interest rate differential. Because there is no forward contract locking in the price, UIRP carries significant exchange rate risk. If the currency market behaves unexpectedly, the investor could face substantial losses. Why is Interest Rate Parity Important for Investors? Interest Rate Parity is not just an academic theory; it is a highly practical tool used by global investors to evaluate currency valuations and manage portfolio risk. Firstly, it helps institutional traders identify potential mispricings in the market. If Covered Interest Rate Parity is temporarily broken, large financial institutions can execute risk-free arbitrage strategies, instantly buying and selling currencies across borders to capture a guaranteed profit before the market corrects itself. Secondly, understanding these interest rate differentials is crucial for investors executing carry trades. A carry trade involves borrowing a currency with a low interest rate to fund the purchase of a currency with a high interest rate. While major pairs are often used for this, traders frequently look toward minor and exotic currency pairs to find the largest, most lucrative interest rate gaps. However, traders must remember that according to Uncovered Interest Rate Parity, the high-yielding currency is theoretically expected to depreciate, which can quickly wipe out the interest earned if the market moves aggressively against them. Discover High-Yield Opportunities Explore exotic and minor currency pairs to leverage global interest rate differentials Learn About Exotic Pairs What Happens When Interest Rate Parity is Broken? In highly liquid, modern financial markets, Covered Interest Rate Parity holds true almost all the time. When it is momentarily broken, automated trading algorithms immediately execute massive volumes of arbitrage trades, snapping the market back into balance within fractions of a second. However, true parity can sometimes be hindered by real-world friction. Capital controls, varying international tax laws, and sudden drops in

Interest Rate Parity قراءة المزيد »

Initial Maintenance Margin thumbnail

Initial vs. Maintenance Margin

Initial vs. Maintenance Margin Understanding Initial and Maintenance Margins: A Comprehensive Guide In the world of professional trading, leverage is a powerful tool that allows investors to increase their market exposure. However, to use leverage effectively, one must understand the “collateral” rules set by exchanges and brokers. These rules are governed by two primary concepts: Initial Margin and Maintenance Margin. Whether you are trading equities, futures, or currencies, grasping these terms is essential for protecting your capital and avoiding the dreaded “margin call.” This guide breaks down everything you need to know in a clear, professional manner. Table of Contents What is the fundamental difference between Initial and Maintenance Margin? How does Initial Margin work when opening a new position? Why is Maintenance Margin critical for risk management? What happens if your account balance falls below the Maintenance Margin? How can traders effectively manage margin requirements? Conclusion & Key Takeaways What is the fundamental difference between Initial and Maintenance Margin? To trade on leverage, you aren’t required to pay the full value of an asset upfront. Instead, you provide a portion of the value as a “good faith deposit.” The Initial Margin is the percentage of the purchase price that an investor must pay for with their own cash when establishing a position. Think of it as the entry requirement. On the other hand, the Maintenance Margin is the minimum amount of equity that must remain in the account as long as the position is open. While the initial margin is about starting a trade, the maintenance margin is about keeping it. If the market moves against you and your account equity drops, the maintenance level acts as a floor to ensure you have enough funds to cover potential losses. This is a core part of the trading products we offer, where margin requirements vary by asset class. How does Initial Margin work when opening a new position? When you decide to enter a trade—for example, in the global futures and options market—the exchange sets a specific dollar amount or percentage required to hold that contract. This is your Initial Margin. For instance, if you wish to buy $100,000 worth of an asset and the initial margin requirement is 10%, you must have at least $10,000 in your account. This allows you to control a large position with a relatively small amount of capital. It is important to note that these requirements can change based on market volatility; during periods of high uncertainty, brokers may increase these rates to protect both the firm and the client. Why is Maintenance Margin critical for risk management? Once your trade is live, the value of your account fluctuates every second. The Maintenance Margin ensures that you always have a “buffer.” Regulatory bodies usually set this lower than the initial margin—often around 25% to 30% of the total value of the securities. The reason this is so critical is that it protects the integrity of the market. By ensuring traders maintain a minimum equity level, it prevents a scenario where a trader owes more than they have in their account. For those trading CFDs or other fast-moving assets, monitoring these levels across different positions is vital to ensure that a drop in one asset doesn’t trigger liquidations across your entire portfolio. View Investment Solutions Explore our wide range of trading products. View Products What happens if your account balance falls below the Maintenance Margin? If the market moves against your position and your account equity dips below the maintenance threshold, you will receive a Margin Call. This is a formal notice from your broker requesting that you deposit more funds or close out positions to bring the account back up to the required level. If a trader fails to meet the margin call promptly, the broker has the right to close (liquidate) the positions at the current market price to prevent further losses. This is why many experienced traders check our daily market updates regularly to stay ahead of price swings that could impact their margin health. How can traders effectively manage margin requirements? Managing margin is less about the math and more about discipline. Here are three professional strategies: Maintain Excess Liquidity: Never use 100% of your available margin. Keeping a “cash cushion” allows your positions to breathe during normal market fluctuations. Monitor Volatility: In volatile markets, margin requirements can increase suddenly. Staying updated on Indian equity markets or global trends can help you anticipate these changes. Use Stop-Loss Orders: By setting a price at which your trade automatically closes, you can ensure your equity never drops near the maintenance margin level. By staying informed and using the resources provided by PhillipCapital, investors can set alerts and monitor their margin utilization in real-time. Conclusion & Key Takeaways Understanding the distinction between initial and maintenance margins is a non-negotiable skill for any trader using leverage. While the initial margin gets you into the market, the maintenance margin keeps you there safely. Key Takeaways: Initial Margin: The “entry fee” or the upfront capital required to open a leveraged position. Maintenance Margin: The minimum equity required to keep the position active. Margin Calls: Triggered when equity falls below maintenance levels, requiring immediate action. Risk Control: Best achieved by keeping extra capital and staying educated on market movements. Partner With PhillipCapital Open an account with a trusted, regulated broker. Open Live Account Frequently Asked Questions (FAQs) How do I actually know if a stock is “high quality”? Look for three primary indicators: consistent profitability over several years, low levels of debt compared to cash reserves, and a strong competitive advantage (like a powerful brand or unique technology). If a company can easily survive a tough economic environment without needing to borrow heavily, it is generally considered a high-quality business. Are quality stocks the same as dividend stocks? Not always. While many high-quality companies pay reliable dividends due to their strong cash flow, others choose to reinvest that cash back into the business to fuel further expansion.

Initial vs. Maintenance Margin قراءة المزيد »

Quality Investing thumbnail

Quality Investing

Quality Investing Introduction In the rapidly evolving financial landscape of 2026, investors are consistently seeking reliable methods to grow and protect their wealth. Amidst volatile market cycles and unpredictable economic shifts, one approach has stood the test of time: quality investing. This trading strategy focuses on a simple but profound principle—owning shares in fundamentally superior businesses. Rather than chasing fleeting trends or attempting to time market bottoms, quality investing emphasizes patience, resilience, and business fundamentals. It involves selecting companies that boast stable earnings, strong balance sheets, and durable competitive advantages. While this often means paying a premium for these premium stocks, the expectation is that their fundamental strength will deliver consistent, compounding long-term returns. In this comprehensive guide, we will explore the inner workings of this approach, define what makes a company “high-quality,” and explain how you can apply this strategy to your own portfolio. Table of Contents What Exactly is Quality Investing? What Are the Key Characteristics of a High-Quality Company? Why Do Quality Investors Pay a Premium for Certain Stocks? How Does Quality Investing Compare to Value or Growth Strategies? How Can Investors Implement a Quality Investing Strategy? Conclusion: Key Takeaways What Exactly is Quality Investing? Quality investing is an equity investment strategy that prioritizes the fundamental financial health and business model sustainability of a company over its current share price momentum. At its core, it is about identifying businesses that have a proven track record of generating cash, surviving economic downturns, and outperforming their peers over multiple market cycles. When you explore various trading strategies in the modern market, quality investing stands out as a highly resilient method. It does not rely on speculative growth projections or finding severely distressed companies at a discount. Instead, it operates on the belief that a company with excellent operational efficiency and a dominant market position will naturally increase in value over time. Investors utilizing this method act more like business owners than short-term traders. They look under the hood of a corporation to examine its debt levels, profit margins, and management efficiency. By filtering out companies with unpredictable earnings or heavy debt burdens, investors reduce their downside risk and position their portfolios to weather market turbulence gracefully. What Are the Key Characteristics of a High-Quality Company? To effectively execute a quality investing strategy, one must know exactly what to look for. High-quality companies typically share a distinct set of fundamental traits that separate them from the broader market. Stable and Predictable Earnings A hallmark of a premium business is its ability to generate consistent profits year after year, regardless of the broader economic environment. These companies do not experience wild swings from massive profits one year to devastating losses the next. Instead, their earnings charts look like a steady staircase moving upward. This predictability often stems from selling essential products or services that consumers and businesses need, ensuring a steady stream of revenue. Strong Balance Sheets Debt can be a silent wealth destroyer during periods of rising interest rates or economic contraction. High-quality companies maintain remarkably strong balance sheets, characterized by low debt-to-equity ratios and abundant cash reserves. This financial cushion allows them to self-fund their growth, pay consistent dividends, and even acquire struggling competitors during market downturns. Building a portfolio of global stocks requires access to robust markets, and investors can easily access these premium assets through deliverable equity and global stocks platforms that offer comprehensive market reach. Durable Competitive Advantages (Economic Moats) Perhaps the most critical element of a quality stock is its “economic moat”—a durable competitive advantage that protects its market share from rivals. This moat could take the form of strong brand recognition, proprietary technology, high switching costs for customers, or a massive network effect. A wide moat ensures that the company can maintain its high profit margins and pricing power for decades without being easily disrupted by new industry entrants. Ready to Upgrade Your Portfolio? Access premium global equities and build your quality investment portfolio with our secure trading platforms. Explore Global Equities Why Do Quality Investors Pay a Premium for Certain Stocks? One of the most common hurdles for new investors is the sticker shock associated with high-quality companies. Because these businesses are universally recognized as reliable and profitable, their stocks rarely trade at steep discounts. They often feature higher Price-to-Earnings (P/E) ratios than average companies. However, seasoned investors willingly pay this premium. The justification lies in the compounding nature of consistent returns. A company that can reinvest its earnings at a high rate of return for twenty years will ultimately create vastly more shareholder wealth than a mediocre company bought at a seemingly cheap price. The premium paid upfront is essentially an “insurance policy” on the safety and predictability of the business model. Furthermore, while some investors prefer the complex payoff structures found in structured products to manage risk and guarantee capital protection, quality investors seek downside protection through the inherent strength of the underlying asset. They understand that a premium price is justified when the business possesses the pricing power to pass inflation costs onto consumers without losing sales volume. How Does Quality Investing Compare to Value or Growth Strategies? Understanding how quality investing fits into the broader ecosystem of market strategies requires comparing it to the two most famous traditional methods: value investing and growth investing. Value investors hunt for bargains. They look for stocks trading below their intrinsic value, often focusing on companies that are temporarily distressed or ignored by the market. The risk here is the “value trap,” where a cheap stock is cheap because the underlying business is fundamentally flawed. Growth investors, on the other hand, look for companies expanding their revenues and earnings at an explosive rate. These are often young, innovative tech or consumer firms. While the upside can be massive, these companies may lack current profitability and can suffer severe drawdowns if their aggressive growth projections fall short. Quality investing sits comfortably between the two. It avoids the speculative risks of pure growth investing

Quality Investing قراءة المزيد »

Participation Structures thumbnail

Participation Structures in Structured Products

Participation Structures Maximizing Market Opportunities: A Guide to Participation Structures Structured products offer a unique middle ground between traditional stocks and fixed-income assets. Among the various types available to investors, Participation Structures are perhaps the most popular for those looking to mirror market movements while adding specific risk-management features. In this guide, we break down what participation structures are, how they function, and the different types you can utilize to enhance your portfolio’s performance through professional investment solutions. Table of Contents What are Participation Structures? How do Tracker Certificates work? What makes Bonus Certificates different? When should an investor choose Outperformance Certificates? Are there specific risks to consider? Conclusion & Key Takeaways What exactly are Participation Structures in the world of investments? At its core, a participation structure is a type of structured product designed to give the investor exposure to the performance of an underlying asset—such as a stock index, a basket of equities, or a commodity—without requiring the investor to own the physical asset. Unlike “yield enhancement” products that focus on generating a fixed coupon, participation products are built to track the price movements of the market. If the underlying asset goes up, your investment generally goes up in tandem. These are excellent tools for wealth management and structured notes because they can be customized to offer full market exposure or protected exposure depending on your market view. How do Tracker Certificates function for a standard investor? Tracker Certificates are the most straightforward form of participation. They aim to replicate the performance of an underlying instrument on a 1:1 basis. If the index rises by 5%, the certificate rises by 5% (minus any small management fees). These are highly efficient for investors who want to gain exposure to specific niches, such as global stocks and equities, without the complexity of buying every individual stock in an index. They offer high transparency and liquidity, making them a staple for diversified portfolios. Ready to diversify your portfolio? Access global markets with precision through our expert-led trading services. View Our Services What makes Bonus Certificates a unique choice for cautious optimists? Bonus Certificates provide a “buffer” or a safety net. They allow you to participate in the upward movement of an asset, but they also offer a “Bonus Level.” As long as the underlying asset does not drop below a predefined “Barrier,” you receive a minimum bonus payment at maturity, even if the market stayed flat or fell slightly. This structure is ideal for sideways-moving markets. It rewards the investor for being “right enough” while protecting them from moderate volatility. Many investors use these when looking at structured notes for UAE investors to find ways to protect capital while still seeking growth in uncertain environments. When should an investor consider Outperformance Certificates? If you have a very strong bullish conviction on a specific sector, Outperformance Certificates are the tool of choice. These structures allow you to participate at a higher rate (e.g., 1.5x or 2x) in the gains of the underlying asset above a certain strike price. For example, if the market rises by 10%, an outperformance structure might deliver a 15% return. This “leverage” without the traditional risks of margin trading makes them a sophisticated choice for those trading global derivatives who want to maximize their capital efficiency during a bull run. What are the primary risks involved with these structures? While participation structures offer great flexibility, they are not without risk. The most significant is Issuer Risk—the possibility that the financial institution issuing the product cannot fulfill its obligations. Additionally, if a “Barrier” is breached in a Bonus Certificate, the protection disappears, and the product behaves like a standard stock, potentially leading to losses. It is vital to work with a regulated entity to ensure you understand the components and risks of structured products and the creditworthiness of the underlying structures. Consult with Our Experts Tailored Strategies for Professional Investors Speak with our specialists to design a participation structure that fits your goals Contact Now Conclusion & Key Takeaways Participation structures are versatile instruments that can be tailored to almost any market outlook. Whether you want simple market tracking or sophisticated “outperformance” capabilities, these products provide a roadmap to achieving specific financial goals. Key Takeaways: Efficiency: Tracker certificates offer a simple, cost-effective way to mirror market indices. Protection: Bonus certificates provide a safety buffer against moderate market declines. Growth: Outperformance structures allow for amplified gains in strongly bullish scenarios. Customization: These products can be mapped to your specific risk tolerance and market expectations. Frequently Asked Questions (FAQs) How do participation products differ from simply buying stocks? While buying a stock gives you direct ownership, a participation structure is a contract that mirrors the asset’s price. The key difference lies in the “extras”—structures can include safety barriers or amplified returns (leverage) that you cannot get by simply holding the underlying share. Do I receive dividends when holding a Tracker Certificate? Typically, no. Most participation products are linked to the “price return” of an index, meaning dividends are not paid out to the investor. However, these “lost” dividends are often used by the issuer to fund the protection features or higher participation rates that make the product attractive. What happens if the market goes sideways or stays flat? In a flat market, a standard Tracker Certificate will remain unchanged in value. However, a Bonus Certificate shines in this scenario; it can still pay out a predefined bonus amount even if the market doesn’t move, provided the underlying asset never touched the “barrier” level. Is my initial investment 100% safe in these structures? Not necessarily. Unlike capital-guaranteed products, participation structures often carry “conditional” protection. If the market drops significantly and hits a specific barrier, you could lose a portion of your principal. Additionally, all structured products carry issuer risk, meaning you rely on the financial strength of the institution that issued the note. Disclaimer: Trading foreign exchange and/or contracts for difference on margin carries a high level of risk, and may

Participation Structures in Structured Products قراءة المزيد »

Discounted Cash Flow DCF Model Thumbnail

Discounted Cash Flow (DCF) Model

Discounted Cash Flow (DCF) Model Understanding the Discounted Cash Flow (DCF) Model in Stock Valuation Have you ever wondered if a stock is genuinely worth its current market price, or if it is just being driven up by temporary hype? For investors seeking to build long-term wealth, distinguishing between a stock’s market price and its true, underlying value is essential. This is where fundamental analysis comes into play, and arguably no tool is more respected for finding that true value than the Discounted Cash Flow (DCF) model. While it might sound complex at first, the core idea behind DCF is incredibly straightforward and logical. In this guide, we will break down exactly how this valuation method works, why it is heavily favored by professional analysts, and how it can help you make more informed, confident investment decisions. Table of Contents What Exactly is the Discounted Cash Flow (DCF) Model? Why Do Investors Rely on the DCF Model? How Does the DCF Formula Work in Simple Terms? What Are the Main Advantages and Limitations of DCF? How Can You Apply DCF in Real-World Investing? Conclusion: Key Takeaways on DCF Valuation Frequently Asked Questions (FAQs) About DCF Valuation What Exactly is the Discounted Cash Flow (DCF) Model? The Discounted Cash Flow (DCF) model is a valuation method used to estimate the value of an investment based on its expected future cash flows. In plain English, it attempts to figure out the current value of a company based on how much money that company is expected to make in the future. To understand DCF, you first have to understand the “Time Value of Money.” This is a core financial principle stating that a dollar you receive today is worth more than a dollar you receive next year. Why? Because you can invest today’s dollar and earn interest or returns on it. Therefore, if you are looking at the cash a company will generate five years from now, you cannot value it exactly the same as cash it holds today. You have to “discount” those future earnings back to their present value. When analyzing global equities, analysts use the DCF model to strip away market sentiment. Instead of looking at what other people are willing to pay for a share, they look strictly at the cash the business is bringing through the door. If the value calculated through the DCF model is higher than the current cost of the investment, the opportunity might be a good one. Why Do Investors Rely on the DCF Model? Investors, particularly those with a long-term horizon, rely heavily on the DCF model because it focuses on absolute, intrinsic value rather than relative value. Many popular valuation metrics, like the Price-to-Earnings (P/E) ratio, are relative. They tell you if a stock is cheap or expensive compared to its peers or its own history. However, if the entire market is overvalued, a “cheap” stock might still be a bad investment. The DCF model ignores the broader market’s mood swings. It acts as a financial anchor, relying purely on the business’s ability to generate cash. Furthermore, the DCF model requires an investor to think deeply about the future of the company. You cannot just look at past performance; you must evaluate the company’s growth strategy, profit margins, and the risks it faces in its industry. By utilizing robust market research, investors can make highly educated forecasts about a company’s trajectory, allowing the DCF model to paint a realistic picture of long-term potential. Access Global Markets Today Trade international stocks and build your portfolio with a regulated broker in the DIFC. Explore Investment Products How Does the DCF Formula Work in Simple Terms? While the math can get intricate, the basic structure of the DCF formula is quite logical. Here is what the formula looks like: Cash Flow (CF): This is the money the company actually generates from its operations, after paying for the costs of keeping the business running (like buying new equipment or paying rent). We call this “Free Cash Flow.” You must estimate this for each future year (CF1 for year one, CF2 for year two, etc.). Discount Rate (r): This is the crucial part. The discount rate is the rate of return you require to make the investment worthwhile, factoring in the risk. If a company is highly risky, you demand a higher return, which means a higher discount rate. Time Period (n): The specific future year the cash flow is expected to be received, often represented as (1+r)n. To find the value of a stock, an analyst forecasts the free cash flows for a certain period (usually 5 to 10 years), discounts each of those years back to today’s value using the discount rate, and adds them all together. Finally, they calculate a “Terminal Value” (the estimated value of the company forever after that 10-year period), discount that back, and add it to the total. Divide that final massive number by the number of shares the company has, and you get the true intrinsic value per share. What Are the Main Advantages and Limitations of DCF? Like any financial tool, the DCF model is incredibly powerful but not completely flawless. Understanding its strengths and weaknesses is vital for any serious investor. Advantages: Focuses on Cash: Accounting profits can be manipulated through clever bookkeeping. Cash cannot. By focusing on free cash flow, the DCF model looks at the true lifeblood of a business. Intrinsic Valuation: It provides a specific price target that isn’t influenced by whether the stock market is currently in a bubble or a crash. Detailed Analysis: It forces investors to scrutinize all aspects of a business, from operating costs to capital expenditures. Limitations: Garbage In, Garbage Out: The DCF model is highly sensitive to your assumptions. If your forecast for year 5 cash flows is too optimistic, or if your discount rate is off by just a few percentage points, the final stock value will be wildly inaccurate. Not Ideal for Every Company: It

Discounted Cash Flow (DCF) Model قراءة المزيد »

Currency Carry Trade Thumbnail

Currency Carry Trade

Currency Carry Trade Unlocking Global Yields: The Definitive Guide to the Currency Carry Trade Table of Contents Introduction What is a Currency Carry Trade and How Does It Work? Which Currencies Are Most Commonly Used in Carry Trades? How Does Leverage Impact the Returns of a Carry Trade? What Are the Primary Risks Associated with the Currency Carry Trade Strategy? How Do Central Bank Policies and Interest Rates Influence Carry Trades? Can Retail Investors Effectively Execute a Currency Carry Trade? Conclusion Introduction In the dynamic landscape of global capital markets, sophisticated investors continuously seek strategies that generate yield independent of traditional equity market rallies. Operating from strategic financial hubs like Dubai, which bridges East and West, provides a unique vantage point to capitalize on macroeconomic divergences across the globe. One of the most historically prominent strategies for capturing these macroeconomic shifts is the currency carry trade. By leveraging the differences in borrowing costs between nations, investors can essentially get paid for holding a position over time. However, this strategy is not without its complexities. Successfully navigating the carry trade requires a deep understanding of monetary policy, currency valuations, and rigorous risk management. This guide explores the mechanics, opportunities, and inherent risks of deploying this strategy in today’s volatile markets. What is a Currency Carry Trade and How Does It Work? At its core, a currency carry trade is an investment strategy where a trader borrows a currency from a country with a low interest rate (the funding currency) to purchase a currency from a country with a high interest rate (the target or asset currency). The primary objective is to capture the “yield differential” or the “carry”—the difference between the interest earned on the high-yielding currency and the interest paid on the borrowed low-yielding currency. Mechanically, when you execute a trade in the foreign exchange market, you are simultaneously buying one currency and selling another. If you buy a currency pair where the base currency has a higher interest rate than the quote currency, your broker will typically credit your account with a daily “rollover” or “swap” fee for every day you hold the position open past the daily market close. Conversely, if the situation is reversed, you would pay this fee. The strategy assumes that the exchange rate between the two currencies will either remain stable or appreciate in favor of the high-yielding currency, allowing the trader to pocket the interest difference without suffering capital losses from currency depreciation. Which Currencies Are Most Commonly Used in Carry Trades? The selection of currencies is the foundational building block of a successful carry trade. Historically, the most effective trades pair stable, low-inflation economies with those experiencing robust growth and higher borrowing costs. The Funding Currencies: The Japanese Yen (JPY) and the Swiss Franc (CHF) have historically been the premier funding currencies. For decades, the Bank of Japan maintained zero or even negative interest rates to combat deflation, making the Yen exceptionally cheap to borrow. The Target Currencies: Historically, the Australian Dollar (AUD) and New Zealand Dollar (NZD) served as prime target currencies due to their commodities-backed economies and higher domestic rates. Emerging Markets: Modern traders often look toward exotic currency pairs to find larger yield spreads. Currencies like the South African Rand (ZAR) or the Mexican Peso (MXN) often boast significantly higher interest rates to attract foreign capital, though they come with elevated volatility. Expand Your Forex Strategy Capitalize on global interest rate differentials with access to a wide range of global currencies. Explore Currency Pairs How Does Leverage Impact the Returns of a Carry Trade? A 3% or 4% annual interest rate differential might seem insignificant to an aggressive investor. However, the true power—and danger—of the carry trade lies in the use of leverage. Because currencies typically experience much lower daily percentage movements compared to equities, brokers offer significant leverage on Spot FX trading accounts. If a trader identifies a pair with a 4% yield differential and applies 10:1 leverage, the annualized yield on the invested margin jumps to 40% (excluding broker fees and spread costs). However, leverage is a double-edged sword. While it exponentially magnifies the yield, it equally magnifies the exposure to exchange rate fluctuations. A minor adverse movement in the currency pair can quickly wipe out months of accumulated interest and lead to a margin call. What Are the Primary Risks Associated with the Currency Carry Trade Strategy? The allure of steady daily income often masks the severe risks inherent in this strategy. The carry trade is famously described as “picking up pennies in front of a steamroller” because the gains are slow and steady, but the losses can be sudden and catastrophic. Exchange Rate Risk: This is the most significant threat. If the high-yielding currency depreciates against the funding currency by an amount greater than the earned interest, the trade results in a net loss. Unwinding Risk: Carry trades are highly sensitive to global risk sentiment. During periods of geopolitical shock or financial panic (often referred to as “risk-off” environments), investors rush to safe-haven currencies (like the JPY or USD) and dump high-yielding, riskier assets. This mass exodus causes a rapid appreciation of the funding currency, leading to sharp, devastating losses for carry traders. Interest Rate Shifts: Understanding exchange rates requires monitoring central banks. If the funding country unexpectedly raises interest rates or the target country lowers them, the yield differential narrows, reducing profitability and often triggering an adverse currency valuation swing. Trade with Confidence in the DIFC Access powerful platforms, deep liquidity, and a comprehensive suite of Spot FX and CFD instruments. Discover Trading Products How Do Central Bank Policies and Interest Rates Influence Carry Trades? Central banks are the architects of the carry trade environment. Their monetary policy decisions dictate the “cost of money,” which in turn drives global capital flows. When the US Federal Reserve embarks on a rate-hiking cycle to combat inflation, the US Dollar often transitions from a potential funding currency into a target currency, drawing capital away from emerging

Currency Carry Trade قراءة المزيد »

Contango Backwardation Explained

Contango & Backwardation Explained

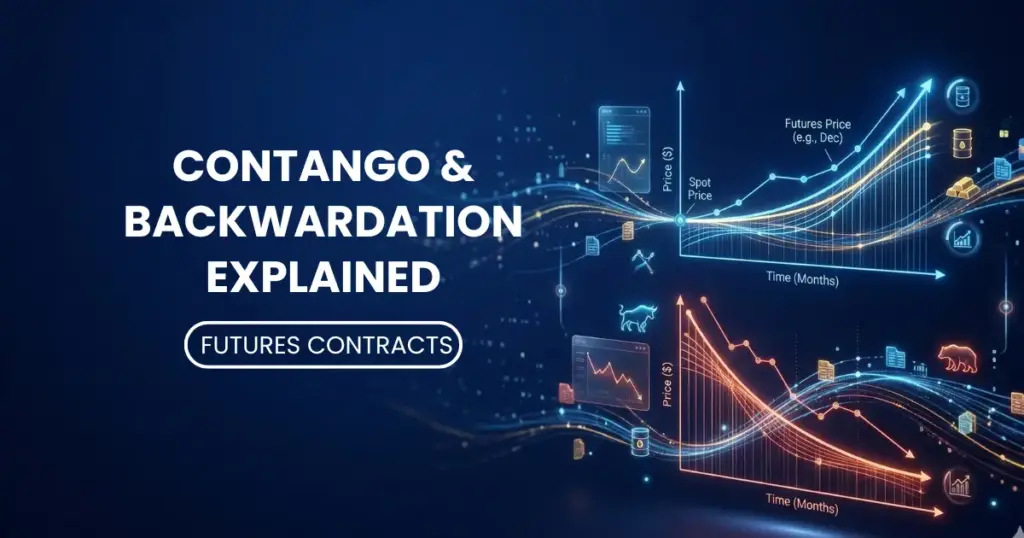
Contango and Backwardation Explained Contango and Backwardation Explained: Navigating Futures Market Curves In the intricate landscape of global capital markets, institutional and sophisticated retail investors rely heavily on derivative instruments to hedge risks, discover prices, and deploy capital efficiently. Among the most critical concepts for anyone trading in these markets are contango and backwardation. These terms describe the shape of the forward curve—the relationship between the current spot price of an asset and its price for future delivery dates. Correctly interpreting whether a market is in contango or backwardation offers profound insights into global supply and demand dynamics, carrying costs, and market sentiment. This comprehensive guide delves into the mechanics of these market states, exploring what drives them and how professional traders navigate their complexities to optimize portfolio performance. Table of Contents What is the Forward Curve in Futures Trading? What Does Contango Mean in Financial Markets? What Causes a Market to Enter Backwardation? How Do Cost of Carry and Yield Impact Contango and Backwardation? How Can Investors Utilize Contango and Backwardation Strategies? What is the Convergence of Spot and Futures Prices at Expiration? Conclusion What is the Forward Curve in Futures Trading? The forward curve is a graphical representation that plots the prices of futures contracts against their respective expiration dates. Rather than looking at a single price point for an asset like crude oil or a stock index, the forward curve provides a multi-dimensional view of how the market values that asset over time. On the x-axis, you have the maturity timeline (ranging from the nearest expiration date to several months or years into the future), while the y-axis represents the contract price. For professional investors, the shape of this curve is a vital diagnostic tool. It rarely forms a perfectly flat line. Instead, it slopes either upward or downward depending on the aggregate expectations of market participants, prevailing interest rates, and the fundamental supply and demand mechanics of the underlying asset. By analyzing the slope of the forward curve, traders can deduce the market’s implied forecast for future price environments and measure the actual costs associated with holding physical or financial assets over time. What Does Contango Mean in Financial Markets? Contango is widely considered the normal, or standard, state of the futures market. A market is in contango when the futures price of an asset is higher than its current spot price, creating an upward-sloping forward curve. As you look further into the future on the expiration timeline, the contracts become progressively more expensive.   This premium on future delivery is not arbitrary. It is heavily driven by the mathematical realities of time-valued money and logistical expenses. When an investor purchases a physical asset today, they incur immediate holding costs, such as warehousing fees, insurance premiums, and the opportunity cost of tying up capital (the risk-free interest rate). Therefore, understanding the relationship between the spot price vs futures price is essential. Buyers in the futures market are willing to pay a premium to lock in a price today while shifting the burden of storing and insuring the asset onto the seller until the future delivery date arrives. In a contango environment, the market is adequately supplied in the short term, and the price curve cleanly reflects the compounded “cost of carry.” Ready to Access Global Futures Markets? Trade international commodities, equities, and FX through a fully regulated platform Explore Futures & Options What Causes a Market to Enter Backwardation? Backwardation is the inverse of contango and is generally considered a rarer, structurally stressed market state. A market falls into backwardation when the futures price is lower than the current spot price, resulting in a downward-sloping forward curve. In this scenario, market participants are paying a heavy premium for immediate possession of the asset rather than waiting for future delivery. This phenomenon is almost exclusively driven by an immediate, urgent imbalance in supply and demand. Severe supply chain disruptions, unexpected geopolitical shocks, or extreme weather events can trigger critical shortages of physical commodities. For example, if a global crisis threatens oil production, refineries cannot wait six months for a futures contract to settle; they need the physical oil immediately to keep operations running. This desperation drives the spot price drastically higher than the deferred futures contracts. Actively calculating the forward-looking basis in futures trading allows investors to detect these supply squeezes early, enabling them to adjust their risk exposure ahead of major macroeconomic adjustments. How Do Cost of Carry and Yield Impact Contango and Backwardation? The concepts of contango and backwardation are fundamentally anchored in two opposing forces: the “cost of carry” and the “convenience yield.” Cost of carry encompasses the explicit expenses required to hold a physical or financial asset. For commodities like gold or wheat, this includes storage space, transit insurance, and financing rates. For financial derivatives, such as equity indices, it primarily involves the prevailing interest rates used to finance the position. These elements form the core of futures fundamentals, dictating how premiums are calculated across different time horizons. When the cost of carry is the dominant force, the market naturally slopes into contango. Conversely, the convenience yield represents the non-financial, operational benefit of physically holding an asset right now. If a manufacturer holds physical copper inventory during a severe supply drought, the convenience yield of keeping their production line open far outweighs the storage costs. When the perceived convenience yield spikes and eclipses the cost of carry, the market is aggressively pushed into backwardation. Additionally, in financial futures, high dividend payouts from underlying stocks can artificially push the curve into backwardation, as futures holders do not receive dividend payments prior to expiration. Master Advanced Derivative Strategies Speak with our institutional trading desk to optimize your portfolio using global derivatives. Contact Our Desk How Can Investors Utilize Contango and Backwardation Strategies? Understanding the shape of the forward curve is paramount for executing long-term trading strategies, particularly those involving the rolling of contracts. When a trader wants to maintain a continuous position in the

Contango & Backwardation Explained قراءة المزيد »

Magic formula Greenblatts Strategy thumbnail

Magic Formula (Greenblatt’s Strategy)

Magic Formula Investing A Guide to Greenblatt’s Systematic Strategy Introduction In the complex ecosystem of global equity markets, identifying sustainable value can often feel overwhelming. Investors are constantly bombarded with macroeconomic noise, speculative trends, and shifting market sentiment. To cut through this volatility, rigorous quantitative frameworks have been developed by leading institutional investors. One of the most renowned is Joel Greenblatt’s Magic Formula—a systematic strategy that ranks stocks by high earnings yield and high return on capital, then buys a basket of the top-ranked stocks. Developed by the founder of Gotham Capital, it is a quantitative value approach designed to find good quality businesses at good prices. By relying strictly on financial mathematics rather than human emotion, the strategy provides a disciplined roadmap for capital allocation. Table of Contents What Is Joel Greenblatt’s Magic Formula Strategy? How Does the Magic Formula Rank Stocks? Why Are Earnings Yield and Return on Capital the Key Metrics? What Are the Advantages of This Quantitative Value Approach? Are There Any Limitations or Risks to the Magic Formula? Conclusion What Is Joel Greenblatt’s Magic Formula Strategy? The Magic Formula is a strictly rules-based value investing framework popularized by hedge fund manager Joel Greenblatt. At its core, the strategy attempts to mathematically codify the legendary investment philosophy of Warren Buffett: buying wonderful companies at fair prices. Instead of relying on subjective forecasts or qualitative business analysis, the formula strips away human bias by focusing entirely on historical financial data. It screens a broad universe of publicly traded companies and ranks them based on two distinct factors: the “cheapness” of the stock (Earnings Yield) and the “quality” of the underlying business (Return on Capital). By combining these two rankings, the strategy identifies a condensed list of companies that offer the optimal intersection of low valuation and high operational efficiency. Before applying advanced quantitative methods to your portfolio, it is imperative to have a solid introduction to stock markets and an understanding of how deliverable equities function within a global framework. The Magic Formula assumes the investor has the capacity to directly purchase and hold actual shares, allowing the underlying business fundamentals to reflect in the stock price over time. How Does the Magic Formula Rank Stocks? The mechanical execution of the strategy is what makes it “systematic.” The ranking process follows a strict, repeatable methodology: Establish a Market Cap Threshold: The strategy begins by defining a universe of investable stocks, typically excluding micro-caps by setting a minimum market capitalization (e.g., $100 million or higher) to ensure adequate market liquidity. Exclude Specific Sectors: Financial institutions (banks, insurance companies) and utility companies are removed from the screening process. Their unique capital structures and heavy regulatory environments make the standard formula metrics less relevant. Calculate Earnings Yield: Every remaining company is ranked by its Earnings Yield, from highest (cheapest) to lowest (most expensive). Calculate Return on Capital: The same companies are then ranked by their Return on Capital (ROC), from highest (most efficient) to lowest (least efficient). Combine the Rankings: The two rank numbers for each company are added together. A company that ranks 15th in Earnings Yield and 10th in ROC would have a combined score of 25. Construct the Basket: The strategy buys a diversified basket of the 20 to 30 companies with the lowest combined scores. These positions are typically held for one year before the portfolio is completely re-evaluated and rebalanced. Access Global Markets with Deliverable Equities Execute value strategies confidently with direct access to US markets. Invest in US Stocks & ETFs Why Are Earnings Yield and Return on Capital the Key Metrics? To understand the power of the strategy, investors must look closely at the specific formulas Greenblatt utilizes, which differ slightly from conventional Wall Street metrics. Earnings Yield (EBIT / Enterprise Value): Traditional investors often use the Price-to-Earnings (P/E) ratio to gauge value. The Magic Formula improves upon this by using Earnings Before Interest and Taxes (EBIT) divided by Enterprise Value (EV). Enterprise Value is a more accurate representation of a company’s price tag because it factors in both the company’s debt and its cash reserves. By using EBIT, the formula evaluates the raw operating profitability of the business before the distortions of varying corporate tax rates and debt interest levels. In short, this metric answers the question: How much operating profit am I getting for the total price of buying the entire business? Return on Capital (EBIT / Net Working Capital + Net Fixed Assets): While traditional Return on Equity (ROE) can be artificially inflated by excessive debt, Greenblatt’s Return on Capital (ROC) measures how effectively a company utilizes its tangible operational assets to generate profit. By dividing EBIT by the sum of net working capital and net fixed assets, the formula isolates the core economic engine of the company. A high ROC indicates a company with a strong competitive advantage, capable of growing its operations without requiring massive external capital injections. Relying solely on surface-level ratios can sometimes lead to poor allocation; therefore, confirming these quantitative signals with a thorough intrinsic value calculation ensures you are deeply analyzing the cash flow generation behind the metrics. What Are the Advantages of This Quantitative Value Approach? The primary advantage of the Magic Formula is its elimination of behavioral finance errors. Human investors are notoriously prone to panic during market corrections and greed during euphoric rallies. By adhering to a systematic, mechanical ranking system, investors are forced to buy out-of-favor companies that possess fundamentally sound operations. Additionally, the strategy enforces portfolio diversification by requiring the purchase of a basket of 20 to 30 stocks. This mitigates single-stock risk, ensuring that a single corporate failure does not devastate the overall capital base. The strategy is also time-efficient; rather than spending hundreds of hours reading subjective analyst reports, the data-driven screen provides a targeted list of high-probability investment candidates. Are There Any Limitations or Risks to the Magic Formula? No quantitative strategy is flawless, and the Magic Formula has distinct challenges. The most prominent risk

Magic Formula (Greenblatt’s Strategy) قراءة المزيد »

Zero Capital Protection thumbnail

Zero Capital Protection

Zero Capital Protection Understanding Zero Capital Protection: Risks, Rewards, and Investment Strategies Table of Contents Introduction What exactly does “zero capital protection” mean in financial markets? How does a zero capital protection strategy differ from fully protected investments? Why would an investor intentionally choose a product with no capital protection? What are the primary risks associated with zero capital protection structures? Which specific types of structured notes feature zero capital protection? How does this strategy align with a sophisticated wealth management portfolio? Conclusion Introduction In the sophisticated ecosystem of global financial markets, investors are constantly navigating the delicate balance between security and potential returns. While many conservative investors gravitate towards safety nets, seasoned market participants often seek out more aggressive vehicles to maximize their yield. This pursuit brings us to the concept of Zero Capital Protection. Unlike traditional fixed-income bonds or heavily buffered derivatives, zero capital protection investments strip away the safety mechanisms that guarantee the return of your initial principal. Instead, they expose the investor to the raw performance of an underlying asset, trading security for the potential of exceptionally high yields or aggressive market participation. Understanding the mechanics, strategic benefits, and inherent risks of these instruments is a fundamental requirement for anyone looking to optimize their wealth generation strategy in today’s dynamic financial landscape. What exactly does “zero capital protection” mean in financial markets? Zero capital protection refers to an investment structure where the investor’s initial principal is entirely at risk, meaning there is no contractual guarantee that the original investment will be returned at maturity. If the underlying asset—whether it is a single equity, a market index, or a basket of commodities—experiences a severe downturn, the investor will absorb those losses directly. In these financial instruments, the performance of the investment is intrinsically linked to the market behavior of the underlying asset. If the asset’s value drops to zero, the investor’s capital drops to zero. This mechanism fundamentally contrasts with principal-protected instruments, which are engineered to shield the investor from catastrophic market crashes. In a zero-protection scenario, the investor accepts a 1:1 downside risk (or a leveraged downside risk, depending on the structure) in exchange for specific financial benefits, such as elevated coupon payments or magnified upside participation. How does a zero capital protection strategy differ from fully protected investments? The difference between these two strategies lies entirely in their financial engineering. To understand this, one must look at the components of structured products. In a capital-protected product, the issuing bank takes the majority of your investment (typically 80% to 90%) and purchases a zero-coupon bond. This bond is mathematically designed to mature to your full original principal amount by the end of the investment term. Only the small remaining fraction of your capital is used to purchase a derivative option, which generates the investment’s return. This ensures full capital protection at maturity, regardless of market volatility. Conversely, a zero capital protection strategy eliminates the zero-coupon bond component entirely. Without the need to divert 80% of the funds into a low-yielding, safe-haven bond, 100% of the investor’s capital can be allocated toward high-performing derivative options, equities, or high-yield structures. This structural pivot removes the safety floor but dramatically increases the financial “firepower” available to generate returns. Why would an investor intentionally choose a product with no capital protection? The decision to forgo a safety net is driven by one primary objective: Yield Enhancement. In flat or low-interest-rate environments, traditional safe-haven assets often fail to outpace inflation, leading to negative real returns. Sophisticated investors—often referred to as “yield hunters”—willingly absorb downside market risk to unlock double-digit annual coupon payments. Because the issuer of the investment does not have to pay for the expensive zero-coupon bond to protect the capital, they can pass those cost savings directly to the investor in the form of significantly higher interest payouts. Furthermore, an investor might choose this route when they have a strong, high-conviction thesis about a specific market. If an investor firmly believes that a particular stock or index will remain stable or rise, paying a premium for capital protection becomes an unnecessary drag on their potential profits. By embracing zero protection, they maximize their capital efficiency and extract the highest possible premium from the market. Ready to Explore High-Yield Structured Notes? Discover bespoke investment products designed for your exact risk appetite. Explore Structured Notes What are the primary risks associated with zero capital protection structures? Removing the capital protection buffer introduces several pronounced risks that require meticulous management: Unmitigated Market Risk: The most obvious threat is the direct exposure to asset depreciation. If the underlying index or stock crashes, your invested capital crashes with it. There is no predefined floor to stop the bleeding. Credit (Counterparty) Risk: Like all structured notes and derivatives, zero-protection products are unsecured debt obligations of the issuing financial institution. Even if the underlying asset performs exceptionally well, if the issuing bank defaults or goes bankrupt, the investor could lose their entire principal. 3. Liquidity Risk: These instruments are generally designed to be held until their maturity date. While secondary markets exist, attempting to liquidate a zero-protection note during a period of high market volatility will almost certainly result in selling at a steep discount. Understanding how these risks interact is a critical component of defining your personal risk and return profile, ensuring that you do not take on exposure that exceeds your portfolio’s tolerance for drawdowns. Which specific types of structured notes feature zero capital protection? Several advanced financial instruments inherently lack capital protection or carry conditions that can trigger a total loss of protection: Reverse Convertibles: These are the quintessential zero-protection yield enhancement tools. They pay extremely high fixed coupons regardless of market movement. However, the repayment of the principal is directly tied to the performance of the underlying asset. If the asset falls below a certain price, the investor may receive physical shares of the depreciated stock instead of their cash principal. Tracker Certificates (Participation Notes): These products aim to replicate the

Zero Capital Protection قراءة المزيد »