

Rho options greek interest rate sensitivity Introduction Most options traders...
اقرأ المزيدVega and volatility risk
Vega and Volatility Risk: How Implied Volatility Moves Option Prices
Most investors learn to watch the underlying price when trading options. Far fewer learn to watch volatility, even though it can move an option’s price just as much, sometimes more, than the underlying ever does. Vega is the measure that puts a number on this, and understanding it is one of the clearest ways to avoid being surprised by an option’s behaviour.
This guide walks through what Vega measures, why implied volatility drives so much of an option’s price, and how volatility risk shows up in real trading situations, from routine market swings to the sharp moves around earnings announcements. Retail investors trading their first options contracts, and professional desks managing larger volatility exposure, will find practical explanations and worked examples they can apply directly.
By the end, the goal is not to memorise a formula. It is to build an intuitive sense of why two options with the same strike and expiry can behave completely differently depending on what the market expects to happen next, and how investors can factor that into their decisions.
Table of Contents
- What Is Vega and What Does It Measure?
- What Is Implied Volatility and Why Does It Drive Option Prices?
- How Does Vega Change Across Strikes and Time to Expiry?
- What Is Volatility Risk and How Does It Affect an Options Position?
- What Is Volatility Crush and When Should Investors Watch for It?
- Long Volatility vs Short Volatility: A Side-by-Side Comparison
- How Does Vega Interact With Delta, Gamma, and Theta?
- How Can Investors Manage Vega and Volatility Risk?
- What Mistakes Do Traders Commonly Make With Vega?
- الأسئلة الشائعة
What Is Vega and What Does It Measure?
Vega measures how much an option’s price is expected to change for every one percentage point move in implied volatility, holding the underlying price and time to expiry constant. Unlike Delta or Theta, which respond to price movement or the passage of time, Vega responds purely to a shift in the market’s expectations about future movement.
Vega is expressed in the same currency as the option premium. An option with a Vega of 0.12 is expected to gain roughly 0.12 in price if implied volatility rises by one percentage point, and lose roughly the same amount if implied volatility falls by one point, all else being equal.
Both call and put options carry positive Vega when they are held long, since higher expected movement in either direction increases the chance the option finishes with meaningful value.
It helps to picture Vega as a measure of how much an option’s price depends on uncertainty itself, rather than on any particular direction. Two options on the same stock, with identical strike prices and expiry dates, can trade at noticeably different premiums purely because the market expects one period to be calmer than another. Vega is what quantifies that difference. This is one of the four primary Greeks covered in Options Greeks Explained: Delta, Gamma, Theta, Vega, and it is the one most closely tied to market sentiment rather than price or time.
Vega values are generated by an option pricing model, most commonly the Black-Scholes model, which takes the underlying price, strike price, time to expiry, the risk-free rate, and volatility as inputs. Investors do not need to calculate Vega manually. Most trading platforms display it alongside an option’s bid and ask price, updated continuously as implied volatility shifts throughout the trading session.
What Is Implied Volatility and Why Does It Drive Option Prices?
Implied volatility is the market’s collective estimate of how much an underlying asset is likely to move before an option expires, expressed as an annualised percentage. It is not a forecast of direction. It is a forecast of magnitude, and it is derived by working backward from current option prices rather than calculated from historical data.
Implied volatility differs from historical volatility, which simply measures how much an asset has actually moved in the past. Implied volatility instead reflects what option buyers and sellers are collectively willing to pay right now, given what they expect could happen between today and expiry. When investors expect a calm, uneventful period, implied volatility tends to sit lower, and option premiums shrink accordingly. When investors expect turbulence, whether from an earnings release, a central bank decision, or broader market stress, implied volatility rises, and premiums rise with it, even if the underlying price has not moved at all.
This relationship explains a pattern that often confuses new investors: an option can become more expensive on a day the underlying barely moves, simply because uncertainty about the future has increased. Consider a stock trading at a stable price in the days before a major product announcement. As the announcement date approaches, implied volatility on that stock’s options typically climbs, since the market recognises that the announcement could move the price sharply in either direction. An investor holding a call option purely because of Vega exposure could see the position gain value during this period, even without the underlying moving an inch.
Implied volatility also tends to move in cycles tied to broader market conditions. During periods of macroeconomic uncertainty, involving inflation surprises, interest rate decisions, or geopolitical events, implied volatility across the wider market often rises together, a pattern sometimes tracked through instruments like VIX futures, which are built specifically to measure and trade expectations of broad market volatility. Understanding where implied volatility currently sits, relative to its recent range, gives investors useful context before entering any options position.
Trade Options With Live Volatility Data at Your Fingertips
See real-time implied volatility, Vega, and the full Greeks suite on every contract, across a broad range of global underlyings, through a DFSA-regulated brokerage.
How Does Vega Change Across Strikes and Time to Expiry?
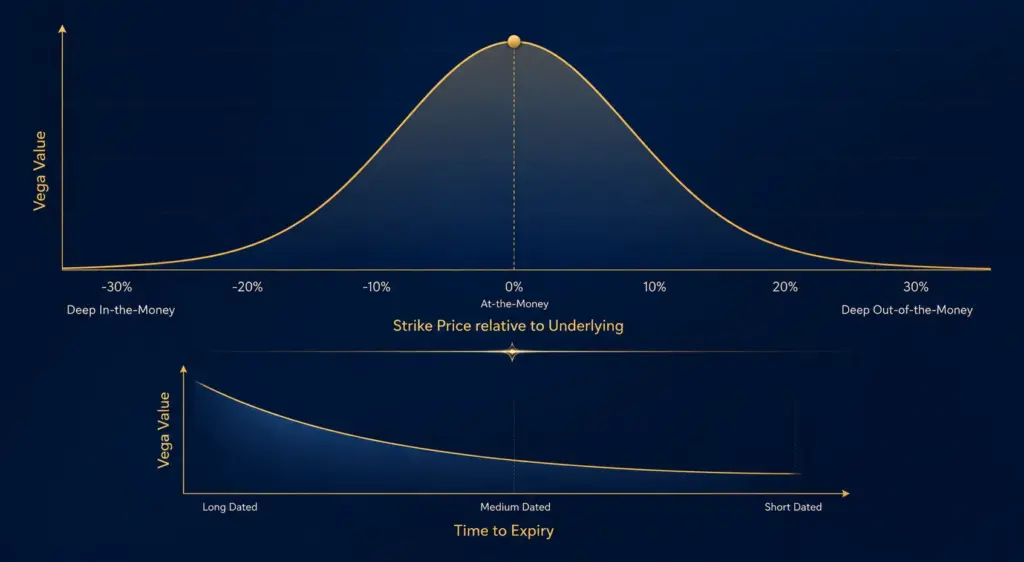
Vega is generally highest for at-the-money options and for options with more time remaining until expiry. Options that are deep in the money, far out of the money, or close to expiration tend to carry much lower Vega, since there is either less uncertainty about their outcome or less time for volatility to meaningfully affect the result.
At-the-money options carry the highest Vega because their outcome is genuinely uncertain. A strike price sitting right at the current market price means the option could plausibly finish in the money or out of the money, so a shift in expected volatility has the biggest impact on its theoretical value. Deep in-the-money options behave much more like the underlying asset itself, and deep out-of-the-money options already have a low probability of finishing profitably, so a change in volatility expectations moves their price by a smaller amount in both cases.
Time to expiry has an equally strong effect. An option with six months remaining has far more time for volatility to play a role in the eventual outcome than an option expiring in three days. This is why Vega is typically largest for longer-dated contracts and shrinks steadily as expiry approaches, even if implied volatility itself stays completely unchanged. A useful way to picture this is to imagine two otherwise identical options, one expiring next week and one expiring in six months. A one-point rise in implied volatility might add a small fraction of a point to the near-term option’s price, but could add several times that to the longer-dated option, simply because there is more time available for that additional uncertainty to matter.
Investors comparing options across an entire chain will often notice Vega peak somewhere near the current underlying price and decline steadily as strikes move further away in either direction, forming a curve that professional desks watch closely when structuring positions.
What Is Volatility Risk and How Does It Affect an Options Position?
Volatility risk is the exposure an options position has to changes in implied volatility, separate from the risk created by the underlying asset’s price movement or the passage of time. It matters because a position can lose value from a drop in volatility even when the investor’s directional view on the underlying turns out to be correct.
This distinction is easy to underestimate. An investor who buys a call option is usually focused on whether the underlying will rise. But that same investor also holds positive Vega exposure, meaning the position benefits from rising implied volatility and suffers from falling implied volatility, independent of what the stock or index actually does. If implied volatility falls sharply after the option is purchased, perhaps because the market has become more confident and less uncertain about the near-term outlook, the option’s price can decline even as the underlying inches higher, because the loss from falling Vega outweighs the gain from Delta.
Volatility risk cuts both ways. Option sellers carry negative Vega, meaning they benefit when implied volatility falls and are exposed to losses when it rises unexpectedly. A trader who sells a put option to collect premium is implicitly betting, whether they think of it this way or not, that volatility will hold steady or decline. If volatility instead spikes, perhaps due to a sudden market shock, the value of that short put can rise sharply against the seller, even before the underlying price has moved significantly.
Volatility risk tends to be underappreciated by newer investors because it is less visible day to day than price risk. A stock chart clearly shows whether the underlying is rising or falling. Implied volatility does not have the same intuitive visual cue for most retail investors, which is part of why it catches people off guard. Reviewing an option’s Vega alongside its Delta before entering a trade gives a fuller picture of what is genuinely being risked.
What Is Volatility Crush and When Should Investors Watch for It?
Volatility crush is the sharp, rapid decline in implied volatility that typically occurs immediately after a scheduled event, such as an earnings release or a major economic announcement, once the uncertainty the market was pricing in has been resolved. It can cause an option to lose significant value even when the underlying moves in the direction the investor expected.
The mechanics behind this are straightforward once Vega is understood. In the days or weeks leading up to a known event, implied volatility on the affected underlying’s options tends to climb, as the market prices in the possibility of a large move. Once the event occurs and the outcome becomes known, the uncertainty disappears almost instantly, and implied volatility often collapses back toward its normal range within hours. Options priced with that elevated volatility baked in can lose a substantial portion of their value purely from this collapse, separate from whatever the underlying price does.
Consider a hypothetical scenario. An investor buys a call option two days before a company’s quarterly earnings release, when implied volatility is elevated due to anticipation of the announcement. The report comes out, and the stock rises modestly, roughly in line with the investor’s expectations. Despite being directionally correct, the investor finds the option has gained far less value than anticipated, or has even lost value, because implied volatility fell sharply once the earnings uncertainty was resolved, and that drop in Vega more than offset the modest gain from Delta.
This pattern is well known enough that it has a name across trading desks, and it is one of the most common reasons new options buyers feel confused after a correct directional call still produces a disappointing result. Investors planning to trade options around scheduled events benefit from checking where implied volatility currently sits relative to its recent average before entering a position, rather than focusing purely on which direction they expect the underlying to move.
Long Volatility vs Short Volatility: A Side-by-Side Comparison
Options positions can be grouped by whether they benefit from rising or falling volatility, and this framing often matters more for risk management than whether the position is a call or a put.
| Aspect | Long Volatility Positions | Short Volatility Positions |
|---|---|---|
| Typical structure | Buying calls, puts, or straddles | Selling calls, puts, or credit spreads |
| Vega exposure | Positive: gains value as implied volatility rises | Negative: gains value as implied volatility falls |
| Best environment | Ahead of expected uncertainty or sharp price swings | Calm, range-bound markets with steady or falling volatility |
| Main risk | Volatility crush eroding value even with a correct directional view | A sudden volatility spike moving sharply against the position |
| Typical investor use | Speculating on a large move or hedging against a shock | Collecting premium income during quieter market conditions |
Reading this table alongside an option’s Delta gives a clearer sense of what a position is actually exposed to. A long call is not only a bet that the underlying will rise. It is also, implicitly, a bet that implied volatility will hold steady or increase. A short put is not only a bet that the underlying will stay above the strike. It is also, implicitly, a bet that volatility will remain calm. Recognising both dimensions of exposure helps investors size positions more deliberately and avoid being caught off guard when one dimension moves against them even as the other behaves as expected.
How Does Vega Interact With Delta, Gamma, and Theta?
No option position experiences Vega in isolation. Delta, Gamma, Theta, and Vega all act at the same time, and understanding how they interact gives a far more complete picture of a position’s true risk than looking at any single Greek alone.
Consider an investor holding a long call option purchased 45 days before expiry, when implied volatility is moderate. On any given trading day, several forces are working simultaneously. If the underlying rises, Delta and Gamma add value to the position, and that gain accelerates as the underlying moves further in the option’s favour. At the same time, Theta is quietly eroding a small amount of value each day, regardless of what the underlying does. If implied volatility also happens to rise that day, Vega adds a further tailwind. If volatility instead falls, even by a modest amount, Vega works against the position and can partially or fully offset the gains from Delta.
This is precisely why an option can sometimes move in a direction that seems to contradict what the underlying asset just did. A call option can lose value on a day the underlying rises modestly, if the combined drag from Theta and a falling Vega outweighs the gain from Delta. This outcome puzzles many investors new to options trading, but it becomes intuitive once each Greek is understood as a separate force acting at the same time rather than a single number.
Professional and institutional desks manage this complexity by monitoring the full set of Greeks together rather than individually, and by using strategies such as Delta hedging to isolate their exposure to specific risks. A market maker, for example, might keep a position’s net Delta close to zero specifically so they can profit from Vega or Theta without taking on directional risk from the underlying’s price movement. This is one reason large derivatives books are typically reviewed as a set of aggregate exposures across Delta, Gamma, Theta, and Vega, rather than contract by contract.
Institutional-Grade Volatility Management for Professional Portfolios
Access direct market connectivity to major global derivatives exchanges, with dedicated specialists supporting volatility-based hedging and structured positioning.
How Can Investors Manage Vega and Volatility Risk?
Investors can manage volatility risk by checking where implied volatility currently sits before entering a trade, sizing positions with Vega exposure in mind, and using structures that reduce sensitivity to volatility swings when the directional view is the primary focus.
- Checking implied volatility before buying options. Comparing current implied volatility against its recent range gives a sense of whether options are relatively expensive or relatively cheap from a volatility standpoint. Buying options when implied volatility is already elevated increases exposure to a future volatility crush, even if the directional call proves correct.
- Being selective around scheduled events. Earnings releases, central bank meetings, and other known catalysts typically carry elevated implied volatility in the days beforehand. Investors who want exposure to the event’s outcome without paying an inflated volatility premium sometimes consider strategies that reduce net Vega exposure, such as spreads that combine a long and short option.
- Reviewing Vega as part of the full Greeks picture, not in isolation. A position with a favourable Delta but significant negative exposure from Theta and Vega can carry more risk than it first appears. Checking all four Greeks together before entering a trade gives a fuller view of what is genuinely being risked.
- Matching position size to volatility exposure, not just directional conviction. An investor with strong conviction about direction but limited appetite for volatility swings might prefer a shorter-dated, more moderately priced structure over a long-dated option with substantial Vega exposure.
- Using spreads to reduce net Vega where appropriate. Combining a long option with a short option at a different strike, within the same expiry, typically reduces net Vega exposure relative to holding a single long option outright, since the Vega of the short leg partially offsets the Vega of the long leg.
- Institutional and professional desks often formalise this further, aggregating Vega across an entire portfolio to understand net sensitivity to volatility shifts at any given moment, and using instruments tied to broad market volatility to hedge that exposure when it grows beyond a defined risk limit.
What Mistakes Do Traders Commonly Make With Vega?
The most common mistake is focusing entirely on Delta and direction while overlooking the fact that a position also carries meaningful Vega exposure, which can work for or against the trade regardless of how the underlying moves.
- Buying options purely for an event without checking implied volatility first. Purchasing a call or put ahead of an earnings release or major announcement, without noting that implied volatility is already elevated, often means paying a premium that is vulnerable to a sharp volatility crush once the event has passed.
- Assuming a correct directional call guarantees a profit. As covered above, an option can lose value even when the underlying moves in the anticipated direction, if the loss from falling Vega outweighs the gain from Delta. This is one of the most frequent sources of confusion for newer options investors.
- Ignoring how Vega compounds with Theta on longer-dated options. Long-dated options carry higher Vega, but they also accumulate Theta decay over their life. An investor holding a long-dated option through a period where volatility gradually declines can experience a slow, steady erosion of value from both forces at once.
- Treating all options on the same underlying as having similar Vega. As explained earlier, at-the-money options with more time to expiry carry meaningfully higher Vega than deep in-the-money, deep out-of-the-money, or near-expiry contracts. Assuming Vega is roughly uniform across a chain can lead to miscalibrated expectations about how a position will behave.
- Overlooking Vega in multi-leg strategies. Investors constructing spreads sometimes evaluate each leg individually without summing the position’s net Vega. A spread’s combined sensitivity to volatility can look very different from what either leg would suggest in isolation, and understanding the net exposure is essential before entering a multi-leg trade.
Take the Next Step in Options Trading
Open a DFSA-regulated trading account and get direct access to a full range of global options markets, live Greeks data, and transparent pricing.

A Final Word on Vega and Volatility Risk
Vega captures a dimension of options trading that is easy to overlook but genuinely central to how prices behave. An option’s premium reflects far more than a simple bet on direction. It also reflects the market’s current view on how much uncertainty lies ahead, and that view can shift quickly, sometimes independently of anything the underlying asset does. Investors who build a habit of checking implied volatility alongside Delta, and who understand how Vega interacts with the other Greeks, are better placed to interpret why a position behaved the way it did, and to size future trades with a fuller view of the risk involved.
Vega sits alongside Delta, Gamma, and Theta as one of the four Greeks most relevant to everyday options trading, and reviewing how they interact provides a far more complete foundation than studying any single measure on its own.
Frequently Asked Questions (FAQs)
Does Vega affect both call and put options?
Yes. Both long calls and long puts carry positive Vega, meaning their value tends to rise when implied volatility increases and fall when it decreases. Short calls and short puts carry the opposite, negative Vega exposure, benefiting from falling implied volatility.
Why do options get more expensive before earnings?
Implied volatility typically rises ahead of scheduled events like earnings releases, since the market is pricing in the possibility of a larger than usual move. This increase in implied volatility raises the Vega-driven component of an option’s price, independent of what the underlying stock actually does.
What happens to Vega as an option nears expiration?
Vega generally declines as expiration approaches, since there is less remaining time for volatility to influence the outcome. Options with only a few days left tend to have low Vega, even if implied volatility itself is elevated at that moment.
Can investors hedge against volatility risk?
Yes, though approaches vary by sophistication and market access. Retail investors often manage volatility risk by checking implied volatility before entering trades and using spreads that reduce net Vega. Institutional desks sometimes use instruments tied to broad market volatility indices to hedge larger, aggregated exposure.
Disclaimer:
Trading foreign exchange and/or contracts for difference on margin carries a high level of risk, and may not be suitable for all investors as you could sustain losses in excess of deposits. The products are intended for retail, professional and eligible counterparty clients. Before deciding to trade any products offered by PhillipCapital (DIFC) Private Limited you should carefully consider your objectives, financial situation, needs and level of experience. You should be aware of all the risks associated with trading on margin. The content of the Website must not be construed as personal advice. For retail, professional and eligible counterparty clients. Before deciding to trade any products offered by PhillipCapital (DIFC) Private Limited you should carefully consider your objectives, financial situation, needs and level of experience. You should be aware of all the risks associated with trading on margin.
Rolling Spot Contracts and CFDs are complex instruments and come with a high risk of losing money rapidly due to leverage. 78% of our retail client accounts lose money while trading with us. You should consider whether you understand how Rolling Spot Contracts and CFDs work, and whether you can afford to take the high risk of losing your money.
Vega and Volatility Risk
Vega and volatility risk Vega and Volatility Risk: How Implied...
اقرأ المزيد
Gamma Risk and Gamma Scalping
Gamma Risk and Gamma Scalping Gamma Risk and Gamma Scalping:...
اقرأ المزيد
Delta Hedging and Delta Neutrality
Delta Hedging and Delta Neutrality Delta Hedging and Delta Neutrality:...
اقرأ المزيد
The Greeks: Delta, Gamma, Theta, and Vega
Options Greeks : Delta, Gamma, Theta, Vega The Greeks: Delta,...
اقرأ المزيد
Black-Scholes Model Basics
Black-Scholes model Black-Scholes Model Basics: How Options Traders Understand Fair...
اقرأ المزيد
Options Exercise & Assignment
Options Exercise & Assignment Table of Contents Introduction What Does...
اقرأ المزيد
American vs European Options
American vs European Options Table of Contents Introduction What Is...
اقرأ المزيد
Options Expiration Dates
Options Expiration Dates Table of Contents Introduction What Is an...
اقرأ المزيد
Intrinsic Value and Time Value
Intrinsic Value and Time Value Introduction When you buy or...
اقرأ المزيد
In-the-Money, At-the-Money, Out-of-the-Money Options
In-the-Money, At-the-Money, Out-of-the-Money Options Introduction If you have started exploring...
اقرأ المزيد

Call Options Explained
Call Options Explained Table of Contents Introduction What Exactly Is...
اقرأ المزيد
Options Fundamentals
Options Fundamentals Table of Contents Introduction What Is an Option...
اقرأ المزيد
VIX Futures & Volatility Futures
VIX Futures & Volatility Futures Table of Contents Introduction What...
اقرأ المزيد
Precious Metals Futures
Precious Metals Futures What Are Precious Metals Futures? A Guide...
اقرأ المزيد
Agricultural Futures
Agricultural Futures Agricultural Futures: Hedging and Trading Strategies Agricultural futures...
اقرأ المزيد
Energy Futures Trading
Energy Futures Trading Introduction Energy is the lifeblood of the...
اقرأ المزيد
Commodity Futures
Commodity Futures What Are Commodity Futures? A Comprehensive Guide for...
اقرأ المزيد

Interest Rate Futures
Interest Rate Futures Mastering Interest Rate Futures: A Strategic Guide...
اقرأ المزيد

Cash Settlement vs Physical Delivery
Cash Settlement vs Physical Delivery in Trading Cash Settlement vs...
اقرأ المزيد
Futures Settlement Methods
Futures Settlement Methods Introduction Navigating the financial markets requires a...
اقرأ المزيد
Margin Calls & Mark-to-Market
Margin Calls & Mark-to-Market Table of Contents Introduction to Futures...
اقرأ المزيد
Initial vs. Maintenance Margin
Initial vs. Maintenance Margin Understanding Initial and Maintenance Margins: A...
اقرأ المزيد
Contango & Backwardation Explained
Contango and Backwardation Explained Contango and Backwardation Explained: Navigating Futures...
اقرأ المزيد
Forward-Looking Basis
Forward-Looking Basis in Futures Trading Table of Contents Introduction What...
اقرأ المزيد