PhillipCapital DIFC Research Team

Municipal Bonds and Tax Implications thumbnail

Municipal Bonds and Tax Implications

Municipal Bonds & Tax Implications Introduction When investors look for stable, lower-risk income from their portfolios, fixed-income instruments often top the list. Among these, municipal bonds occupy a unique position — they are issued by government bodies to fund public projects, and in many jurisdictions, carry meaningful tax advantages. For investors building diversified, income-focused portfolios, understanding how municipal bonds work and how they are taxed is essential. This guide breaks down everything you need to know about municipal bonds — from their basic structure to how tax treatment varies across investor types and geographies. Table of Contents What Are Municipal Bonds? How Do Municipal Bonds Work? What Are the Main Types of Municipal Bonds? What Tax Advantages Do Municipal Bonds Offer? Are Municipal Bonds Always Tax-Free? How Does Tax-Equivalent Yield Work? What Risks Should Investors Consider? Are Municipal Bonds Relevant for International Investors? Conclusion & Key Takeaways What Are Municipal Bonds? Municipal bonds — often called “munis” — are debt instruments issued by local or regional government authorities to raise capital for public infrastructure and services. The issuers may include city councils, state governments, public utilities, school districts, or transit authorities. In return for lending money, investors receive regular interest payments (known as coupon payments) and the return of their principal at maturity. What makes municipal bonds distinct from corporate bonds or sovereign bonds is their issuer — a government entity with the power to levy taxes or collect service revenues. This backing gives municipal bonds a relatively conservative credit profile, making them a popular choice among income-focused and capital-preservation investors. To understand how bonds are categorised more broadly, the Bond Types and Structures guide on our platform provides a strong foundation for comparing different fixed-income instruments. How Do Municipal Bonds Work? Municipal bonds operate on the same basic principle as any bond. The issuing authority borrows a set amount of money from investors for a defined period — which can range from one year to 30 years or more. During this period, the issuer makes periodic interest payments (typically semi-annually), and upon maturity, returns the face value of the bond. The interest rate (coupon) is set at the time of issuance and reflects the creditworthiness of the issuer, prevailing market rates, and the bond’s maturity. Bonds issued by financially strong municipalities tend to offer lower yields — reflecting lower risk — while those from less creditworthy issuers offer higher yields to attract buyers. Municipal bonds can be bought at issuance (primary market) or traded in the secondary market. Their prices fluctuate with interest rate movements, just like other fixed-income securities. For a more detailed look at how bond prices are calculated, refer to Bond Pricing and Valuation. What Are the Main Types of Municipal Bonds? General Obligation Bonds (GO Bonds) These bonds are backed by the full faith and credit of the issuing government body, meaning the issuer can raise taxes if needed to meet repayment obligations. Because of this backing, GO bonds are considered among the safest municipal bonds and typically carry lower yields. Revenue Bonds Revenue bonds are repaid using income generated by a specific project — such as toll roads, airports, water utilities, or hospitals. Since they rely on project revenues rather than tax income, they carry slightly higher risk than GO bonds but often offer better yields. Taxable Municipal Bonds While many municipal bonds offer tax-exempt interest, some projects do not qualify for tax exemption under local laws. These bonds are issued as taxable municipal bonds, typically offering higher coupon rates to compensate for the lack of tax benefit. Zero-Coupon Municipal Bonds These are issued at a deep discount to face value and pay no regular interest. Instead, the investor receives the full face value at maturity. The difference between purchase price and face value represents the investor’s return — and in many cases, this implied return can also be tax-exempt. What Tax Advantages Do Municipal Bonds Offer? This is where municipal bonds truly stand out. In the United States — the world’s largest municipal bond market — interest income earned from most municipal bonds is exempt from federal income tax. In addition, if an investor lives in the same state that issued the bond, the income is often exempt from state and local taxes as well, making it effectively triple tax-exempt in certain cases. This tax treatment is extremely valuable for investors in higher income brackets, where a tax-exempt yield of, say, 3% can be far more beneficial than a fully taxable yield of 4.5% once taxes are accounted for. These tax benefits stem from the fact that municipal bonds fund projects of public benefit — schools, hospitals, roads, clean water systems — and governments encourage investment in these projects by offering preferential tax treatment to bondholders. From a portfolio perspective, Bond Duration and Risk is worth reviewing alongside tax considerations, as the interplay between duration, yield, and tax treatment shapes the total after-tax return of any fixed-income position. Access Global Bond Markets Through PhillipCapital DIFC Trade sovereign and corporate bonds across global markets with expert support. Explore Bond & Debentures Trading Are Municipal Bonds Always Tax-Free? Not always. While the tax-exempt status of municipal bonds is one of their most attractive features, several important exceptions apply: Capital Gains Tax: If an investor sells a municipal bond in the secondary market at a profit before maturity, that capital gain may be subject to tax, even if the interest itself was tax-exempt. Alternative Minimum Tax (AMT): Some municipal bonds — specifically those classified as “private activity bonds” — may be subject to the AMT in the United States, reducing the effective tax benefit for certain investors. Discount Bonds: If a municipal bond is purchased at a market discount (below face value) and held to maturity, the discount amount may be taxed as ordinary income in some jurisdictions, not as a capital gain. Non-US Investors: Investors outside the US are generally not eligible for US federal tax exemptions on municipal bond interest. International investors should


Municipal Bonds and Tax Implications قراءة المزيد »

Daily Market Updates june 10 thumbnail

Daily Market Updates – June 10

10 June 2026 – Daily Market Updates Daily Market Brief: Cautious Tone Ahead of Inflation Test Markets are set for a softer open as investors brace for a pivotal US inflation update and another heavy slate of supply in government bonds. After a whipsaw session to start the week—marked by sharp rotations within mega-cap technology and AI-adjacent names—risk appetite looks more measured. European equities are broadly weaker, US equity futures point lower, and Asian markets closed mixed as traders reassess the path of policy and growth. Macro and policy All eyes on inflation: This week’s US consumer price data will help determine whether the “higher-for-longer” rates narrative hardens or eases. A sticky core print would reinforce expectations that policy stays restrictive for longer, while any cooling could reopen discussion of eventual rate relief. Rates repricing: Treasury yields are holding near recent highs as markets shift from debating the timing of cuts to weighing the risk of additional tightening if inflation proves persistent. Elevated sovereign issuance and firmer real yields continue to pressure duration. Global backdrop: Geopolitical tensions remain a background risk and are contributing to periodic haven flows. Meanwhile, major central banks outside the US face their own trade-offs between stubborn inflation and slowing activity, keeping cross-asset correlations fluid. Equities Tech-led volatility: The rally leaders of the year—semiconductors, AI infrastructure, and high-growth software—have shown larger intraday swings as investors digest capital-raising plans, changing order visibility, and valuation stretch. Positioning remains crowded in select themes, amplifying reversals. Cyclical vs. defensives: With yields elevated, defensives and cash-generative quality franchises have provided relative ballast, while domestically oriented cyclicals are trading more on incoming macro data than on micro news. Expect factor leadership to hinge on the inflation print and rate path signals. Earnings in focus: Results from consumer internet, software, and select industrial technology names will offer fresh reads on demand durability, margins, and capex tied to AI buildouts. Guidance around back-half growth and pricing power will be closely watched. Fixed income Sovereign supply front and center: Governments have been active issuers, and the supply calendar remains busy. Higher term premiums and concession needs are keeping a lid on bond rallies into auctions. Credit steady but selective: Investment-grade spreads are contained, reflecting healthy corporate balance sheets. In high yield, dispersion is increasing as refinancing windows remain open for stronger issuers but more challenging for weaker capital structures if yields stay elevated. Navigate Global Markets with Confidence Access global equities, fixed income, futures, and structured notes with a DFSA-regulated broker. Explore Our Trading Products Commodities Oil steady: Crude is treading water as supply discipline counters demand concerns. Any surprise in inflation or growth data could sway near-term direction via the dollar and risk sentiment. Gold under pressure: Firmer real yields and a stronger dollar have weighed on precious metals. Physical demand and central bank buying remain supportive on pullbacks, but near-term price action is chiefly a rates story. Industrial metals mixed: Signals from manufacturing PMIs and China activity data remain key drivers. Positioning is cautious pending clearer visibility on global growth into the second half. Digital assets Crypto’s bounce looks tentative: After a sharp slide last week, the major coin has recovered some ground but faces a tougher macro tape. Rising real yields and tighter liquidity typically compress risk premiums across speculative assets. Flows and positioning: Spot product flows have softened recently, and derivatives metrics suggest limited conviction for a durable upturn. Option skews imply demand for downside protection remains elevated relative to interest in longer-dated upside. Key swing factors: Macro liquidity, regulatory headlines, and techncial levels around prior support zones. Without a sustained improvement in broader risk appetite, rallies may struggle to extend. Private markets and deal flow Exit environment: The backlog of private equity exits is still sizable. With financing costs normalizing higher and public multiples uneven across sectors, sponsors are weighing longer holds against valuation resets. Capital raising: Companies tied to AI infrastructure and next-gen computing continue to tap markets to fund expansion, leading to episodic equity volatility. Investors are scrutinizing dilution, payback periods, and visibility on orders. What to watch US inflation report: Headline, core, and supercore trends; shelter disinflation pace; goods vs. services split. Central bank signaling: Updated projections and any language around balance sheet runoff and term premiums. Sovereign auctions: Bid-to-cover dynamics and tail sizes as tests of demand at current yield levels. Earnings: Updates from consumer, cloud/software, and industrial tech for clues on pricing power and AI-driven capex. Geopolitics: Any escalation that could impact energy markets, shipping routes, or safe-haven flows. Bottom Line Markets are entering an event-heavy stretch with tighter financial conditions already doing some of the Fed’s work. A benign inflation surprise could extend the soft-landing narrative and ease pressure on duration and high-multiple growth. A hotter print would likely reinforce higher real yields, favor quality balance sheets, and keep pressure on gold and crypto. Stay nimble, mind liquidity, and focus on balance-sheet strength, cash flow visibility, and pricing power until the macro path clarifies. Institutional-Grade Brokerage Solutions Comprehensive multi-asset execution, API connectivity, and clearing services tailored for funds and family offices. Discover Institutional Services Disclaimer: Trading foreign exchange and/or contracts for difference on margin carries a high level of risk, and may not be suitable for all investors as you could sustain losses in excess of deposits. The products are intended for retail, professional and eligible counterparty clients. Before deciding to trade any products offered by PhillipCapital (DIFC) Private Limited you should carefully consider your objectives, financial situation, needs and level of experience. You should be aware of all the risks associated with trading on margin. The content of the Website must not be construed as personal advice. For retail, professional and eligible counterparty clients. Before deciding to trade any products offered by PhillipCapital (DIFC) Private Limited you should carefully consider your objectives, financial situation, needs and level of experience. You should be aware of all the risks associated with trading on margin. Rolling Spot Contracts and CFDs are complex instruments and come

Daily Market Updates – June 10 قراءة المزيد »

Corporate Bonds and Corporate Credit thumbnail

Corporate Bonds and Corporate Credit

Government Bonds & Treasury Securities Guide Table of Contents Introduction What Is a Corporate Bond? How Do Corporate Bonds Differ from Government Bonds? What Is Corporate Credit and Why Does It Matter? What Are Credit Ratings and How Do They Work? What Are Investment Grade vs. High Yield Bonds? What Types of Corporate Bonds Exist? What Risks Come with Corporate Bond Investing? How Are Corporate Bonds Priced and Traded? Who Should Consider Corporate Bonds? Conclusion and Key Takeaways Introduction When companies need to raise money, they have two main choices: issue shares or borrow. Corporate bonds are how they borrow — directly from investors like you. In exchange, the company promises to pay interest regularly and return the principal at maturity. For investors, corporate bonds sit in an important middle ground: they typically offer higher returns than government securities, with more structure and predictability than equities. Understanding how corporate credit works is fundamental to building a well-rounded fixed income portfolio. This guide breaks down everything you need to know — from bond structures and credit ratings to risk management and who should invest. What Is a Corporate Bond? A corporate bond is a debt instrument issued by a company to raise capital from investors. When you buy a corporate bond, you are effectively lending money to the issuing company. In return, the company commits to paying you a fixed or variable interest rate — called the coupon — at regular intervals (usually semi-annually), and returning your original investment (the principal or face value) on a specified maturity date. The key components of any corporate bond are: Face Value (Par Value): The amount repaid at maturity, typically USD 1,000 per bond in international markets. Coupon Rate: The annual interest rate paid to bondholders. Maturity Date: When the principal is repaid — short-term (under 3 years), medium-term (3–10 years), or long-term (10+ years). Issuer: The company borrowing the funds. Corporate bonds are part of the broader fixed income asset class. If you are new to how bonds are structured and priced, the foundation concepts covered in Bond Basics provide essential context before diving deeper into corporate credit. How Do Corporate Bonds Differ from Government Bonds? Government bonds — also called sovereign bonds or treasury securities — are issued by national governments, which carry a very low risk of default. Corporate bonds, by contrast, are issued by private and public companies, which carry higher credit risk but typically offer higher yields to compensate. The key differences: Credit Risk: Governments (especially in stable economies) rarely default. Companies can and do face financial difficulties, making corporate bonds riskier — and therefore higher-yielding. Yield Premium: Corporate bonds pay a credit spread above comparable government bond yields. This spread widens when investors perceive more risk and tightens when confidence is high. Liquidity: Government bond markets are generally more liquid. Corporate bonds, particularly from smaller issuers, may be harder to trade quickly without price impact. Tax Treatment: Varies by jurisdiction. In many markets, interest income from both is taxable, but the treatment may differ. Understanding Bond Pricing and Valuation helps you interpret these yield differences accurately and make better investment decisions. What Is Corporate Credit and Why Does It Matter? Corporate credit” refers to the overall creditworthiness of a company — essentially, how likely it is to meet its debt obligations. It is the lens through which bond investors evaluate risk before committing capital. Corporate credit is assessed through: Financial statements — revenue stability, profit margins, debt levels, and cash flow generation. Industry position — competitive strength and exposure to economic cycles. Debt structure — how much debt the company carries versus its earnings (Debt/EBITDA ratio). Management quality — track record of capital allocation and handling downturns. When corporate credit quality deteriorates — for example, if a company takes on too much debt or earnings fall sharply — bond prices fall and yields rise. Conversely, improving credit quality pushes bond prices up. Credit spreads — the difference in yield between a corporate bond and a comparable government bond — are the market’s real-time signal of corporate credit health. Wider spreads mean higher perceived risk; tighter spreads indicate confidence. What Are Credit Ratings and How Do They Work? Credit ratings are independent assessments of a bond issuer’s ability to repay its debt. They are assigned by specialist agencies — most notably Moody’s, S&P Global Ratings, and Fitch Ratings — and form the backbone of how the market prices corporate bonds. The rating scale generally runs as follows: Rating (S&P/Fitch) Moody’s Equivalent Category AAA Aaa Highest quality AA Aa Very high quality A A Upper-medium grade BBB Baa Medium grade (lowest investment grade) BB Ba Speculative / High Yield B B Speculative CCC and below Caa and below Very high risk / Near default Ratings are not static. Agencies review them periodically and may issue upgrades (improving outlook) or downgrades (deteriorating outlook). A downgrade can cause a significant drop in a bond’s price and a spike in its yield — particularly if it falls from investment grade to high yield (a so-called “fallen angel”). For investors accessing global bond markets through platforms like PhillipCapital’s Bond and Debentures service, credit ratings are one of the first filters to apply when evaluating any corporate bond. Ready to Explore Global Bond Markets Access a wide range of sovereign and corporate bonds through PhillipCapital DIFC — trusted by investors across the UAE and beyond. Explore Bonds & Debentures What Are Investment Grade vs. High Yield Bonds? This is one of the most important distinctions in corporate bond investing. Investment Grade Bonds Bonds rated BBB-/Baa3 or above are classified as investment grade. These are issued by financially stable companies with strong credit profiles — think large multinational corporations, blue-chip firms, and utilities. They offer: Lower yields (but safer income) Greater price stability Higher liquidity Eligibility for many institutional mandates and pension funds High Yield Bonds (also called Junk Bonds) Bonds rated BB+/Ba1 or below carry higher credit risk and therefore offer significantly higher yields

Corporate Bonds and Corporate Credit قراءة المزيد »

Daily Market Updates june 9 thumbnail

Daily Market Updates – June 9

9 June 2026 – Daily Market Updates Daily Market Briefing: AI Momentum Lifts Risk Appetite, Rates Stay Firm, Oil Softens Overview Global markets are opening on a constructive note, with equities buoyed by renewed enthusiasm around artificial intelligence and digital infrastructure. Government bond yields remain elevated after strong recent data reset interest-rate expectations, while crude oil is slipping as supply concerns ease and geopolitical risk premiums fade. Crypto remains volatile after last week’s sharp drawdown. Equities US: Futures point higher, led by mega-cap tech and semiconductor names as investors rotate back into AI beneficiaries following a brief pause. Early strength is broadening modestly into software and select cyclicals tied to enterprise spending. Europe: Stocks are mixed to higher, with technology and health care outperforming while energy lags alongside softer crude. Exporters remain sensitive to currency moves as the dollar steadies. Asia: Regional benchmarks mostly advanced. Hardware, foundry, and cloud-exposed names outperformed on expectations for sustained AI capex, while travel and leisure underperformed on company-specific guidance updates. Rates and Currencies US Treasuries: Two-year and five-year yields are holding near recent highs as markets price the possibility of tighter policy or a longer hold amid resilient growth and sticky services inflation. The curve remains relatively flat, reflecting cautious optimism on growth and a slower path toward inflation normalization. Global rates: Select emerging-market central banks are leaning more hawkish to stabilize currencies and stem portfolio outflows, highlighting divergent policy paths versus major developed markets. FX: The dollar is firm against a broad basket on higher US yields. Pro-cyclical currencies are steady to softer; safe havens are range-bound. Commodities and Crypto Energy: Oil prices are retreating as supply appears adequate and headline risks ease. Crack spreads are mixed; backwardation has narrowed, reflecting improved near-term balances. Metals: Gold is consolidating as higher real yields offset safe-haven demand. Industrial metals are supported on hopes for incremental policy support in large manufacturing economies. Digital assets: Crypto is stabilizing after a sizable weekly market-cap decline. Liquidity is thinner and volatility elevated; derivatives positioning suggests a cautious tone with selective dip-buying in large-cap tokens. Corporate and Deal Flow Primary markets: The listing window is reopening, led by high-profile technology and infrastructure names tied to AI, data centers, and next-gen connectivity. Interest is robust, though investors remain sensitive to valuation, governance, and lockup dynamics. M&A: Health care deal activity underscores the premium for late-stage pipelines and targeted oncology. Across tech, partnerships and long-dated capacity commitments continue to anchor the buildout of compute and power. Theme to Watch: Building the Next Industrial Platform Investors are focusing on the convergence of space, AI, communications, and software into integrated platforms. The potential prize is vast—global connectivity, compute at the edge, and data-rich applications—yet the model introduces execution complexity: Pros: Diversified revenue streams, vertical integration, and powerful network effects across hardware, software, and services. Cons: Capital intensity, regulatory scrutiny, cross-entity dependencies, and the challenge of transparent segment reporting. What to watch: Unit economics in launch and broadband, AI model monetization, utilization rates for data centers, and capital allocation discipline. Early trading in landmark listings often brings volatility; disciplined position sizing and staggered entry points can help manage risk. Strategy Thoughts Equities: Emphasize quality growth with strong free cash flow, pricing power, and balance-sheet resilience. Within AI, balance “picks and shovels” (semis, power, cooling, optical, infrastructure software) with selectively owned application-layer exposure. Fixed income: Maintain a neutral-to-slightly short duration bias given upside risks to policy rates; consider barbell approaches to capture carry while preserving flexibility. IG credit with solid coverage remains attractive; be selective in HY. Commodities: With oil softer, reassess hedges and sensitivity to refined-product margins. Gold remains a portfolio diversifier but is sensitive to real yields. Alternatives and crypto: Expect elevated realized volatility. Favor institutional-grade vehicles with robust liquidity terms; avoid leverage concentration and monitor counterparty risk. Risk management: Use options to express views around event risk; employ stop-loss discipline in early-stage listings; diversify across regions and factors as leadership narrows. Optimize Your Portfolio for the AI Era Leverage our tailored wealth management strategies to navigate market volatility and capture high-quality growth opportunities. Explore Wealth Management The Day Ahead Macro: Inflation prints, jobless claims, and sentiment surveys will set the tone for rates and growth expectations. Watch policy remarks from central bank officials for guidance on the reaction function. Micro: AI infrastructure updates, capacity leases, and cloud spending intentions from large customers are key for semis and data-center ecosystems. Energy and metals: Inventory data and any fresh indications on supply policy from producers could sway crude and refined products; industrial metals watch for incremental stimulus signals. Risks to Monitor Re-acceleration in services inflation or wage growth pushing rate expectations higher Tightening financial conditions spilling into credit Geopolitical flare-ups that reprice energy and shipping Power constraints and equipment lead times slowing AI deployment IPO lockup expiries and insider sales adding supply to markets Bottom Line Risk tone is constructive, but higher-for-longer rates and busy primary markets argue for selectivity. Lean on quality, maintain liquidity, and be disciplined on valuation—especially in areas where narratives are strongest and price discovery is still underway. Trade Global Markets with Precision Access advanced execution services and broad asset class coverage tailored for institutional and sophisticated investors. Discover Institutional Brokerage Disclaimer: Trading foreign exchange and/or contracts for difference on margin carries a high level of risk, and may not be suitable for all investors as you could sustain losses in excess of deposits. The products are intended for retail, professional and eligible counterparty clients. Before deciding to trade any products offered by PhillipCapital (DIFC) Private Limited you should carefully consider your objectives, financial situation, needs and level of experience. You should be aware of all the risks associated with trading on margin. The content of the Website must not be construed as personal advice. For retail, professional and eligible counterparty clients. Before deciding to trade any products offered by PhillipCapital (DIFC) Private Limited you should carefully consider your objectives, financial situation, needs and level of experience. You should be

Daily Market Updates – June 9 قراءة المزيد »

Government Bonds Treasury Securities thumbnail

Government Bonds & Treasury Securities

Government Bonds & Treasury Securities Guide Introduction When markets get choppy, investors instinctively look for safer ground. Government bonds and treasury securities have long served as that ground — steady, backed by sovereign governments, and offering predictable returns. Whether you are building a balanced portfolio, managing risk, or simply looking to diversify beyond equities, understanding how these instruments work is essential. This guide breaks down everything you need to know — from the basics of what a government bond actually is, to the different types available, how they’re priced, and what risks you should be aware of before investing. Table of Contents What Is a Government Bond? What Are Treasury Securities? What Are the Main Types of Treasury Securities? How Do Government Bonds Generate Returns? What Is the Relationship Between Bond Prices and Interest Rates? Are Government Bonds Risk-Free? How Do Government Bonds Fit Into a Portfolio? Can Investors Outside the US Access These Securities? Conclusion & Key Takeaways What Is a Government Bond? A government bond is a debt instrument issued by a national government to raise money from investors. When you buy a government bond, you are effectively lending money to the government. In return, the government promises to pay you regular interest (called the coupon) over the life of the bond and return your original investment (the principal) when the bond matures. Governments issue bonds to fund public spending — infrastructure projects, healthcare, education, or to cover budget deficits. Because these bonds are backed by the full faith and credit of a sovereign government, they are widely regarded as among the safest investments available in global capital markets. The key features of a government bond include: Face Value (Par Value): The amount the government will repay at maturity — typically USD 1,000 or equivalent. Coupon Rate: The annual interest rate paid on the face value. Maturity Date: The date when the principal is repaid and the bond expires. Yield: The actual return an investor earns based on the bond’s current market price. If you’re still building your understanding of bond terminology, the bond basics  on our blog pages is a solid starting point before diving deeper into specific bond types. What Are Treasury Securities? Treasury securities are government bonds specifically issued by the United States Department of the Treasury. They are the most widely traded sovereign debt instruments in the world and serve as a global benchmark for risk-free returns. Because the US government has never defaulted on its debt obligations, treasury securities are used by institutional investors, central banks, pension funds, and individual investors worldwide as a safe store of value and a benchmark against which other investments are measured. The yield on US Treasury securities — particularly the 10-year note — is one of the most closely watched indicators in global finance, influencing everything from mortgage rates to corporate bond pricing to equity valuations. What Are the Main Types of Treasury Securities? Not all government bonds are alike. They differ primarily by their maturity period, which affects how much interest they pay and how sensitive they are to market conditions. Treasury Bills (T-Bills) T-Bills are short-term securities that mature in 4, 8, 13, 26, or 52 weeks. They don’t pay a regular coupon. Instead, they are sold at a discount to their face value, and the investor receives the full face value at maturity. The difference between what you paid and what you receive is your return. Example: You purchase a T-Bill for USD 970. At maturity, you receive USD 1,000. Your gain of USD 30 is your effective interest. Treasury Notes (T-Notes) T-Notes are medium-term instruments with maturities of 2, 3, 5, 7, or 10 years. Unlike T-Bills, they pay a fixed coupon every six months, making them popular with investors seeking regular income. The 10-year Treasury Note is the most referenced bond globally. Treasury Bonds (T-Bonds) T-Bonds are long-term instruments with maturities of 20 or 30 years. They pay semi-annual coupons and are preferred by long-horizon investors such as pension funds and insurance companies that need to match long-term liabilities with long-term income. Treasury Inflation-Protected Securities (TIPS) TIPS are designed to protect investors against inflation. The principal value of a TIPS adjusts with changes in the Consumer Price Index (CPI). As inflation rises, so does the face value of the bond — and thus the interest payment, which is calculated on the adjusted principal. This makes TIPS especially relevant in high-inflation environments. Sovereign Bonds From Other Governments Beyond US Treasuries, sovereign bonds are issued by governments worldwide — UK Gilts, German Bunds, Japanese Government Bonds (JGBs), and bonds from GCC nations including Saudi Arabia and the UAE. These bonds operate on the same fundamental principles but carry different risk profiles depending on each country’s credit rating, economic stability, and currency. Diversify your portfolio with sovereign and corporate bonds. PhillipCapital DIFC gives you access to a wide range of fixed income instruments across global markets. Explore Bond & Debentures How Do Government Bonds Generate Returns? Government bonds generate returns through two primary channels: Coupon Income If the bond pays a coupon (as T-Notes and T-Bonds do), you receive fixed interest payments at regular intervals — typically every six months. This makes government bonds attractive for income-focused investors who want predictable cash flows regardless of market conditions. Capital Appreciation (or Depreciation) Bond prices move in the secondary market. If you purchase a bond and interest rates in the economy fall after your purchase, your bond (which pays a higher fixed coupon) becomes more valuable — and you can sell it at a price above what you paid. Conversely, if rates rise, the price of your existing bond falls. Discount-to-Face Value (for T-Bills) As explained earlier, T-Bills are issued at a discount. The return is built into the difference between purchase price and face value at maturity. Understanding how these returns are calculated is closely tied to bond pricing and valuation concepts. The bond pricing and valuation section walks through yield calculations in practical detail.

Government Bonds & Treasury Securities قراءة المزيد »

Daily Market Updates june 8 thumbnail

Daily Market Updates – June 8

8 June 2026 – Daily Market Updates Daily Market Brief: Bulls Make Their Case as Risks Stack Up Overview Equities are attempting to stabilize after a sharp, tech-led setback late last week. Early U.S. futures point modestly higher, even as investors weigh a mix of headwinds: a jump in energy prices, firmer rate expectations, and a pause in the most crowded parts of the AI trade. European stocks are softer, while Asia saw broad declines led by technology-heavy markets. Energy shares are catching a bid on the oil surge, and bond yields are nudging up as inflation anxiety edges higher. What’s driving the tape Energy shock back in focus: Crude extended gains toward the mid-$90s amid heightened geopolitical tensions and supply concerns. Higher fuel costs are filtering through to inflation expectations and pressuring rate-sensitive assets, while lifting oil & gas equities. Rates repricing: Markets are leaning toward a longer stretch of restrictive policy in the U.S. and a more hawkish tone from major central banks abroad. The European Central Bank is in the spotlight this week, with investors debating how far it will go as growth stays uneven and energy costs climb. AI and semis cool off: After months of outperformance, profit-taking hit AI-linked names and high-multiple tech. The longer-term capex cycle around advanced chips and data infrastructure remains a key bull pillar, but near-term valuations are being reassessed. Geopolitics and volatility: An escalation in the Middle East is lifting commodities and volatility. Cross-asset correlations have risen, amplifying moves across equities, rates, and FX. Market snapshot (early U.S. session) U.S. equity futures: Firmer after Friday’s selloff, with megacaps stabilizing and energy leading. Europe: Broad indices softer, cyclicals mixed; energy stronger, rate-sensitive sectors lagging. Asia: Regional benchmarks fell, led by technology and semiconductor names; Korea underperformed. Bonds and FX: Sovereign yields higher across major markets; the dollar broadly supported on rate differentials. Commodities: Oil up sharply on supply/geopolitical risk; gold steady to slightly higher as a defensive hedge. Diversify Your Portfolio with Global Market Access Trade across international equities, futures, and fixed income with institutional-grade tools and dedicated support. Explore Trading Products Why bulls still see a path higher Earnings resilience: Corporate results and guidance in several sectors have outpaced cautious expectations, keeping forward estimates trending up. Investment cycle intact: Multi-year spend on automation, cloud/AI infrastructure, and energy security continues, supporting profit and productivity themes beyond quarter-to-quarter noise. Healthy reset: A pullback in crowded leaders can broaden participation if quality cyclicals and defensives re-rate, reducing concentration risk. Consumer and balance sheets: Household and corporate balance sheets, while mixed, remain reasonably solid in aggregate, offering a buffer if growth slows but avoids a hard landing. Key risks to monitor Sticky inflation from energy: A sustained oil spike risks re-accelerating headline inflation and delaying any policy easing. Policy error: Quick tightening into a soft patch could pressure credit, housing, and capex—particularly in Europe. Valuation sensitivity: High-duration equities remain vulnerable to rate spikes and earnings downgrades. Geopolitical flare-ups: Any disruption to energy flows, trade routes, or supply chains could hit margins and growth expectations. The week ahead: What matters for markets Central banks and policy Europe: ECB decision and press conference. Markets will parse guidance on inflation persistence vs. growth risks. North America: A Canada rate decision and U.S. policy rhetoric ahead of key data may sway front-end rates. Inflation and activity data U.S.: Consumer price inflation and sentiment; housing and inventory updates. Europe: CPI reads across core economies; industrial production snapshots. Asia: China inflation and trade; regional PMIs for demand signals. Sector and micro drivers Energy: Ongoing OPEC commentary and inventory trends vs. geopolitical risk. Tech: Developer conferences and chip-supply headlines; index rebalancing flows later this month. Corporate activity: Consolidation in European banking and selective biopharma partnerships remain themes. Positioning considerations (not investment advice) Diversification: Balance growth and value, with attention to cash-flow durability and pricing power in an energy-up, rates-up tape. Rate sensitivity: Reassess duration across equities and fixed income; consider the impact of higher real yields on long-duration assets. Quality bias: Strong balance sheets and consistent free cash flow can cushion drawdowns if volatility persists. Risk management: Use liquidity windows to review hedges, position sizes, and correlation assumptions as cross-asset swings pick up. Bottom line Markets are recalibrating after an exceptional run, with energy prices and rates doing the heavy lifting on risk premia. Bulls argue the reset can be constructive if earnings and investment cycles hold. The next leg likely hinges on this week’s inflation prints and central-bank signals—clarity there could decide whether the current bounce has legs or gives way to a broader consolidation. Expert Investment Advisory for Volatile Markets Protect and grow your wealth with customized portfolio management and structured solutions tailored to your risk profile. Schedule a Consultation Disclaimer: Trading foreign exchange and/or contracts for difference on margin carries a high level of risk, and may not be suitable for all investors as you could sustain losses in excess of deposits. The products are intended for retail, professional and eligible counterparty clients. Before deciding to trade any products offered by PhillipCapital (DIFC) Private Limited you should carefully consider your objectives, financial situation, needs and level of experience. You should be aware of all the risks associated with trading on margin. The content of the Website must not be construed as personal advice. For retail, professional and eligible counterparty clients. Before deciding to trade any products offered by PhillipCapital (DIFC) Private Limited you should carefully consider your objectives, financial situation, needs and level of experience. You should be aware of all the risks associated with trading on margin. Rolling Spot Contracts and CFDs are complex instruments and come with a high risk of losing money rapidly due to leverage. 78% of our retail client accounts lose money while trading with us. You should consider whether you understand how Rolling Spot Contracts and CFDs work, and whether you can afford to take the high risk of losing your money. Daily Market Updates – July-02 July 2, 2026 02

Daily Market Updates – June 8 قراءة المزيد »

Bollinger Bands Strategy thumbnail

Bollinger Bands Strategy

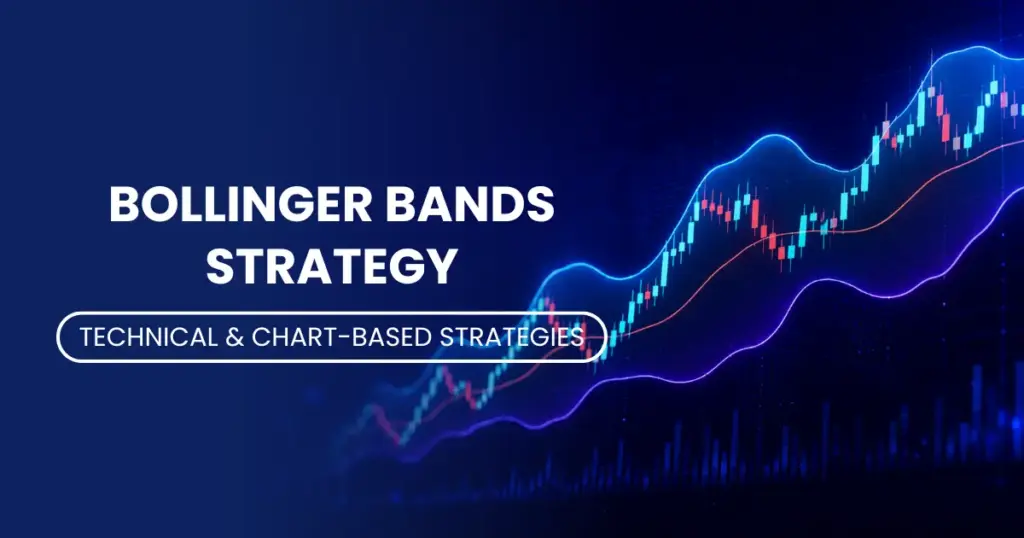
Bollinger Bands Strategy Introduction Every trader, at some point, asks the same question: Is the market about to move — or is it just noise? Bollinger Bands were created to answer exactly that. Developed by John Bollinger in the early 1980s, this tool is now one of the most widely used technical indicators across stocks, forex, commodities, and CFDs worldwide. Whether you are just building your knowledge of trading strategies or looking to sharpen an existing approach, understanding Bollinger Bands can genuinely change how you read a chart. This guide breaks down what they are, how they work, and how to use them practically — without the unnecessary complexity. Table of Contents What Are Bollinger Bands? How Are They Built? What Do They Actually Tell You? What Are the Key Trading Signals? Which Markets Can You Apply Them To? What Indicators Work Well With Bollinger Bands? What Mistakes Should Traders Avoid? Conclusion & Key Takeaways What Are Bollinger Bands? Bollinger Bands are a volatility-based technical indicator displayed directly on a price chart. They consist of three lines that move dynamically with the market: a middle line (which is a moving average of recent prices), an upper band placed above it, and a lower band placed below it. The gap between the upper and lower bands is not fixed — it expands and contracts based on how volatile the market is at any given time. The genius of the tool is in that expansion and contraction. When markets are calm and prices are moving in a tight range, the bands narrow into what traders call a “squeeze.” When markets become volatile and prices start moving sharply, the bands widen. This dynamic behaviour gives traders a visual read on market conditions that a plain price chart alone cannot provide. Unlike fixed support and resistance lines, Bollinger Bands adapt to current market conditions in real time — which is why they remain relevant across different asset classes and time horizons, from intraday trading to weekly swing trades. How Are They Built? Understanding the construction helps you use the tool more confidently. The three components are: Middle Band — A Simple Moving Average (SMA) of closing prices. Default: 20-period SMA. Upper Band — The middle band plus 2 standard deviations. Default: +2 SD. Lower Band — The middle band minus 2 standard deviations. Default: –2 SD. Standard deviation is a measure of how spread out prices are from their average. When prices are moving a lot (high volatility), the standard deviation is large and the bands widen. When prices are stable (low volatility), the standard deviation is small and the bands tighten. The default setting of 20 periods and 2 standard deviations was chosen by Bollinger himself after extensive testing. At this setting, statistically around 95% of price action tends to occur within the bands — which makes a close outside them a notable event worth paying attention to. What Do Bollinger Bands Actually Tell You? Volatility Measurement The primary role of Bollinger Bands is to measure market volatility in real time. A wide band signals a high-volatility environment — prices are moving aggressively. A narrow band signals low volatility — the market is in consolidation mode. Traders pay close attention to transitions between these two states, because a period of low volatility often precedes a sharp price move in either direction. Relative Price Levels The bands also define what is “relatively high” and “relatively low” for a given asset at a given time. A price touching the upper band does not automatically mean “sell” — but it signals that the price is at the high end of its recent range. Similarly, touching the lower band indicates the price is at the low end. Context — such as overall trend direction and volume — always matters when interpreting these levels. Important: Bollinger Bands do not predict the future direction of prices. They describe the current market environment. Combining them with trend or momentum indicators significantly improves their effectiveness. What Are the Key Trading Signals? The Bollinger Band Squeeze This is arguably the most powerful signal the indicator produces. When the bands compress tightly together, it signals that the market has entered a low-volatility consolidation phase. Historically, these quiet periods tend to be followed by significant breakouts. The squeeze itself does not tell you which direction the breakout will go — but it alerts you that a large move may be coming. Traders often combine this signal with volume analysis or momentum indicators to anticipate the direction before committing to a trade. The Breakout Signal Once prices close decisively above the upper band or below the lower band after a squeeze, many traders interpret this as confirmation that a new trend is starting. A close above the upper band may signal the beginning of an upward move; a close below the lower band may signal the start of a downward trend. It is important to wait for confirmation rather than assuming a single candle is enough — false breakouts are common, especially in choppy markets. Mean Reversion Trading In range-bound, sideways markets, prices tend to oscillate between the upper and lower bands without breaking out significantly. In these conditions, traders use a mean reversion approach: when price touches or exceeds the upper band, they look for potential selling opportunities; when price drops below the lower band, they look for potential buying opportunities — on the assumption that prices will revert back toward the middle band. This works well in stable, non-trending markets but can be dangerous when a strong trend is in place. “Walking the Bands” During strong trending markets, prices can “walk” along the upper or lower band for extended periods — meaning they repeatedly close near or above the upper band in an uptrend, or near or below the lower band in a downtrend. This signals strength, not overbought conditions. Attempting to fade a trend simply because prices are at the upper band in a strong bull market is a common and

Bollinger Bands Strategy قراءة المزيد »

Weekly global Market news june week 2 thumbnail

Weekly Global Market News– June–Week 2

Weekly Global Market News – June – Week – 2 Weekly Global Market News– June–Week 2 The big themes 1) IPO watch: SpaceX readies a blockbuster debut What’s new: Media reports indicate SpaceX is set to list this week with one of the largest retail allocations ever attempted in a mega-cap IPO, with talk of up to roughly a quarter of shares earmarked for individual investors. Why it matters: A sizeable retail tranche can amplify first-day liquidity and volatility. It may also re-route retail flows from secondary markets temporarily, affecting turnover in popular momentum names. What to watch: Pricing versus private-market marks and peers in launch, satellite communications, and space infrastructure. Lock-up terms and any directed share programs. Supply-chain beneficiaries across launch systems, satellite components, ground stations, and broadband. Passive inclusion timing. Index eligibility typically lags, but the path to benchmark inclusion will shape longer-term demand 2) Apple’s WWDC: AI showcase and leadership narrative  Product and platform reset: Apple’s developer conference begins Monday and is expected to spotlight system-wide AI features, a revamped Siri, and on-device intelligence. Reports also point to deeper model partnerships with external AI providers. Leadership transition: Apple has signaled a CEO handover to hardware chief John Ternus later this year, with an emphasis on continuity in execution and discipline. Investors will parse Monday’s announcements for momentum heading into 2027 product cycles. Market lens: AI integration trade-offs between on-device performance, privacy, and cloud costs. The potential for a device refresh catalyst if AI features are hardware-accelerated. Services ARPU and ecosystem stickiness if AI features deepen user engagement. 3) Inflation week and central bank signals United States: May CPI on Wednesday and PPI on Thursday will set the tone for rates, the dollar, and equity factor rotations. Focus on core services (ex-housing), shelter deceleration, and goods disinflation durability. Euro area: Country-level prints (France, Germany) land Friday after Thursday’s ECB decision. Markets will watch the policy path and language around growth, wages, and energy sensitivity. China: May CPI update arrives Wednesday, with investors watching the balance between consumer prices and producer-price dynamics for clues on domestic demand and industrial margins. India: CPI on Friday informs the policy glidepath and near-term demand conditions. Canada: The Bank of Canada decides Wednesday; the statement and guidance on activity, housing, and labour tightness will steer CAD and front-end rates. Opec: Thursday’s monthly report will feed into near-term oil balance and crack-spread views. 4) Policy and hearings in Washington Bill Gates is scheduled for a transcribed interview with the House Oversight Committee regarding his past ties to Jeffrey Epstein. Additional high-profile financial figures are also expected before lawmakers in coming weeks. Investor take: While first-order earnings impacts are limited, reputational and regulatory headlines can influence multiples, governance screens, and fund eligibility criteria. 5) Switzerland’s population cap vote Swiss voters head to the polls Sunday on a proposal to limit the population to 10 million. If approved, potential implications span labour availability, housing, infrastructure planning, and longer-run growth assumptions, with knock-ons for CHF, rates, and domestic equities. 6) World Cup 2026 begins The men’s FIFA World Cup kicks off this week across Mexico, the US, and Canada. Near-term winners typically include travel and hospitality, select beverages, quick-service restaurants, advertising platforms, and sports betting. Traffic and security considerations may affect local retail patterns around venues. 7) Politics in focus President Donald Trump turns 80 on Sunday. Markets will stay alert to any policy or campaign-season headlines, though direct market impact from commemorations is typically modest. The trading desk watchlist Space economy: Monitor pricing outcomes, order-book strength, and where retail allocations settle. Satellite operators, launch-adjacent suppliers, ground-network builders, and space-based connectivity platforms are in focus. AI supply chain: Any Apple WWDC hardware acceleration themes could reverberate through semis, memory, edge AI, thermal management, and power ICs. Services and ad-tech may react to new on-device capabilities. Rates and FX: CPI/PPI vs. breakevens and term premium; USD reaction; EUR into and out of the ECB; CAD around the BoC; INR sensitivity to inflation surprise. Energy: Opec’s balances, refining margins, and positioning into summer demand. Europe financials: ECB tone versus sovereign spreads; watch loan-demand surveys and wage commentary for margin outlooks. China macro: Consumer and producer prices for signs of demand stabilization; commodities and Asia credit risk sentiment. World Cup discretionary exposure: Booking trends, stadium-adjacent retail footfall, and ad-load commentary from broadcasters and streamers. Capitalize on Global Volatility with Institutional-Grade Infrastructure Navigate high-impact events like the SpaceX IPO and ECB decisions with low-latency algorithmic trading, direct API connectivity, and dedicated 24×5 desk execution under DFSA oversight. Access Institutional Brokerage A concise calendar Monday Apple WWDC (Cupertino; runs through Friday) Japan Q1 GDP (updated estimate) Germany factory orders US Conference Board Employment Trends Index Australia: King’s Birthday holiday (many states; market closures) Corporate: Campbell Soup, Gloo Tuesday Global ABS 2026 (Barcelona; through Thursday) Germany industrial production UK: BRC retail sales, BoE mortgage and admin stats US trade balance Corporate: Bellway, J.M. Smucker, Oxford Instruments, SailPoint Wednesday US CPI (May) China CPI (May) Canada rate decision Nikkei “Future of Asia” forum (Tokyo; through Thursday) Corporate: Casey’s General Stores, Fuller’s, Oxford Industries, Pennon, WH Smith Thursday ECB policy decision US PPI (May) Opec monthly oil market report Corporate: Adobe, Dollarama, Halma, Chow Tai Fook, LPP, McGraw Hill (investor update), PayPoint, Safestore, Wizz Air Friday SpaceX expected to debut on Nasdaq EU labour market (Q1) France/Germany CPI (May) India CPI (May) UK monthly GDP (April) Bank of Japan accounts Selected world events UK: London Tech Week (Mon–Fri) US: Congressional primaries in several states (Tue) France: B7 Summit (Wed–Thu) Mexico/US/Canada: FIFA World Cup 2026 kicks off (Thu) UK: King’s Birthday Honours (Fri); Trooping the Colour (Sat) Switzerland: Population cap referendum (Sun) Positioning considerations Keep gamma and event risk in view into the CPI/WWDC/ECB cluster; liquidity can gap around overlapping headlines. For IPO participation, review client suitability, lock-up, and execution logistics early given expected retail interest. Consider hedging for idiosyncratic tech volatility if AI announcements reset product roadmaps or cost structures. Watch front-end rates and

Weekly Global Market News– June–Week 2 قراءة المزيد »

Daily Market Updates june 5 thumbnail

Daily Market Updates – June 5

5 June 2026 – Daily Market Updates Daily Market Brief: Caution Builds Ahead of US Jobs Data Overview Markets are treading carefully into the end of the week as investors brace for the latest US employment report. Rates traders are focused on whether hiring and wage trends confirm a cooling economy or extend the “higher-for-longer” interest-rate narrative. Equity futures are softer, led by growth and semiconductor names following an exceptional multi-quarter run. In commodities, crude is holding near recent highs, and digital assets remain choppy. Macro and rates All eyes on payrolls: A softer read on job creation and wage momentum would likely lift Treasuries and ease front-end rate expectations, while a firmer print could nudge yields higher and reinforce the case for restrictive policy a bit longer. The setup: After months of repricing toward tighter policy amid sticky inflation and elevated energy prices, the balance of risks is more two-sided. Oil has stabilized, and several high-frequency indicators point to moderating labor demand. That combination increases the odds of a bond-market rally if the data underwhelm. What matters most: Beyond the headline jobs change, watch average hourly earnings, labor-force participation, and revisions. A benign wage trend alongside steady participation would be especially supportive for duration. Equities US: Futures point lower before the bell, with mega-cap tech and chip-related shares giving back ground after an outsized advance year-to-date. Investors are rotating selectively, reassessing crowded trades tied to artificial intelligence and high-performance computing. Europe: Stocks are mixed to lower, with defensives holding up better than cyclicals ahead of the US data. Rate-sensitive pockets such as real estate and parts of consumer discretionary are under pressure. Asia: Sentiment was fragile. South Korea’s market saw pronounced swings this week as foreign flows reversed and breadth narrowed, underscoring how dependent some benchmarks have become on a handful of leaders. Hedge Your Portfolio with Global Derivatives Access futures and options across 15+ global exchanges to manage risk and capitalize on market volatility. Explore Derivatives Trading Credit and funding Primary issuance remains steady for investment grade borrowers, though many deals are being front-loaded around key data. In high yield, new supply is more selective with a premium for balance-sheet resilience. Spreads are broadly range-bound, but dispersion is increasing across sectors most exposed to rates, input costs, and AI-related capex cycles. Commodities Energy: Crude is little changed near recent peaks as supply dynamics and demand expectations offset each other. Refining margins remain supportive into peak driving season, but macro headlines are dictating day-to-day moves. Metals: Gold is holding firm as investors weigh real yields against haven demand. Industrial metals are consolidating recent gains amid mixed signals from global manufacturing. Currencies and digital assets FX: The dollar is slightly firmer heading into the data, with traders hesitant to take large positions ahead of payrolls. A soft US print would typically pressure the greenback against G10 peers; a beat would likely do the opposite. Crypto: Major tokens are under pressure this week amid broader risk aversion and deleveraging. Price action remains highly sensitive to liquidity conditions and headline risk. What to watch today US employment report: headline payrolls, unemployment rate, wage growth, participation, and prior-month revisions. Rates reaction function: front-end yields and the 2s/10s curve for guidance on policy-path repricing. Equity leadership: whether any post-data bounce broadens beyond a narrow set of winners. Positioning thoughts (not investment advice) Rates: Consider that asymmetry may favor duration on a downside surprise to jobs and wages; conversely, a hot print could keep the front end vulnerable. Equities: Maintain a balanced stance. Quality balance sheets and consistent cash flow remain in favor as markets reassess elevated expectations in select growth themes. Risk management: Into event risk, focus on liquidity buffers and hedging, especially for portfolios concentrated in high-beta technology and rate-sensitive sectors. Data note: Market levels and moves referenced are as of early US morning and are subject to change. Institutional-Grade Execution for Complex Markets Discover bespoke brokerage solutions, API connectivity, and multi-asset coverage tailored for funds, family offices, and professional traders. View Institutional Services Disclaimer: Trading foreign exchange and/or contracts for difference on margin carries a high level of risk, and may not be suitable for all investors as you could sustain losses in excess of deposits. The products are intended for retail, professional and eligible counterparty clients. Before deciding to trade any products offered by PhillipCapital (DIFC) Private Limited you should carefully consider your objectives, financial situation, needs and level of experience. You should be aware of all the risks associated with trading on margin. The content of the Website must not be construed as personal advice. For retail, professional and eligible counterparty clients. Before deciding to trade any products offered by PhillipCapital (DIFC) Private Limited you should carefully consider your objectives, financial situation, needs and level of experience. You should be aware of all the risks associated with trading on margin. Rolling Spot Contracts and CFDs are complex instruments and come with a high risk of losing money rapidly due to leverage. 78% of our retail client accounts lose money while trading with us. You should consider whether you understand how Rolling Spot Contracts and CFDs work, and whether you can afford to take the high risk of losing your money. Daily Market Updates – June 5 June 5, 2026 5 June 2026 – Daily Market Updates Daily Market Brief:… Read More Daily Market Updates – June 4 June 4, 2026 4 June 2026 – Daily Market Updates Markets Morning Briefing… Read More Daily Market Updates – June 3 June 3, 2026 3 June 2026 – Daily Market Updates Markets Morning Briefing:… Read More Daily Market Updates – June 2 June 2, 2026 2 June 2026 – Daily Market Updates Global Markets Morning… Read More Daily Market Updates – June 1 June 1, 2026 1 June 2026 – Daily Market Updates Morning Markets Brief:… Read More Daily Market Updates – May 29 May 29, 2026 29 May 2026 – Daily Market Updates Market Brief: May’s… Read More Daily Market Updates

Daily Market Updates – June 5 قراءة المزيد »

Moving Average Crossover thumbnail

Moving Average Crossover

Moving Average Crossover Introduction Every trader, whether new or experienced, is constantly looking for reliable signals that tell them when to enter or exit a trade. One of the most widely used tools for this purpose is the Moving Average Crossover. It is simple to understand, applies to almost every market, and has stood the test of time across decades of trading. Whether you are trading US stocks and ETFs, exploring CFDs and Spot FX, or building a broader investment strategy, understanding how crossovers work can give you a meaningful edge. This guide answers the most important questions about Moving Average Crossovers in plain, practical language. Table of Contents What Is a Moving Average? What Is a Moving Average Crossover? What Are the Golden Cross and Death Cross? Which Moving Average Periods Should You Use? What Are the Limitations of This Strategy? How Do You Combine This Strategy with Other Tools? Conclusion & Key Takeaways What Is a Moving Average? A moving average (MA) is simply the average price of an asset over a set number of past periods — days, hours, or minutes. It smooths out the noise in price movements so you can see the overall direction more clearly. There are two main types: Simple Moving Average (SMA): Adds up closing prices over a period and divides by the number of periods. For example, a 50-day SMA adds the last 50 days of closing prices and divides by 50. Exponential Moving Average (EMA): Gives more weight to recent prices, making it faster to react to new market developments. Traders who need quicker signals often prefer EMAs. Both types are widely used and available on most trading platforms. If you are just getting started, understanding stock market basics will help you place moving averages in the right context before applying them to live trades. What Is a Moving Average Crossover? A Moving Average Crossover happens when a shorter-period moving average crosses over a longer-period moving average on a price chart. This crossing point is treated as a potential signal for a change in trend direction. The Bullish Crossover (Buy Signal) When the short-term MA crosses above the long-term MA, it signals that recent prices are rising faster than the historical average. This is often interpreted as a buy signal, suggesting the asset may be entering an uptrend. The Bearish Crossover (Sell Signal) When the short-term MA crosses below the long-term MA, it signals that recent prices are falling relative to the historical average. This is generally seen as a sell signal or a prompt to exit a long position. The crossover itself does not guarantee a profitable trade — no indicator ever does. But it provides a structured, rules-based way to act on trend changes rather than relying on gut feel. What Are the Golden Cross and Death Cross? These are two famous crossover patterns that get significant attention from traders and financial media alike. The Golden Cross A Golden Cross occurs when the 50-day moving average crosses above the 200-day moving average. It is widely considered a long-term bullish signal, suggesting that a sustained uptrend may be developing. Institutional investors and fund managers pay close attention to this pattern when making allocation decisions across global equity markets. The Death Cross The Death Cross is the opposite: the 50-day MA crosses below the 200-day MA. It signals a potential long-term downtrend and is often used as a prompt to reduce exposure or shift toward defensive assets. Both signals work across asset classes — equities, forex, commodities, and indices. Ready to Apply Chart Strategies Across Global Markets? Access equities, CFDs, futures, and more — all from one regulated platform in Dubai. Explore Our Trading Products Which Moving Average Periods Should You Use? There is no single “correct” answer — the right periods depend on your trading style and time horizon. Short-term traders (day traders, swing traders): Commonly use the 5-day and 20-day MAs, or even shorter periods like 9 and 21 on intraday charts. These react quickly to price changes but also produce more false signals. Medium-term traders: The 20-day and 50-day combination is a popular choice for capturing trends that last several weeks. Long-term investors: The 50-day and 200-day pairing (as in the Golden/Death Cross) is most appropriate. This combination filters out short-term noise and focuses on major trend shifts. For currency traders using Spot FX and CFDs, EMAs on shorter timeframes (e.g., 12 and 26 periods) are commonly used because forex markets move fast and EMA’s sensitivity to recent price action is an advantage. What Are the Limitations of This Strategy? Understanding the weaknesses of a strategy is just as important as knowing when it works. Lagging by nature: Moving averages are based on past prices, so crossovers always happen after a trend has already begun. You will rarely catch the very top or bottom. Whipsaws in sideways markets: When prices move in a tight range without a clear trend, moving averages cross back and forth repeatedly, generating false buy and sell signals. This can lead to a series of small losses. Not a standalone system: Relying solely on crossovers without confirming with volume, support/resistance levels, or other indicators increases risk. Many experienced traders combine this tool with derivatives and futures strategies to hedge exposure and manage downside risk. Being aware of these limitations helps you use the tool more wisely rather than abandoning it because of occasional false signals. How Do You Combine This Strategy with Other Tools? Professional traders rarely use a single indicator. Moving Average Crossovers are most effective when combined with: Volume analysis: A crossover backed by rising volume carries more weight. A signal on low volume may be unreliable. RSI (Relative Strength Index): If a bullish crossover happens while RSI is below 30 (oversold territory), the buy signal is stronger. Conversely, a bearish crossover while RSI is above 70 (overbought) strengthens the sell case. Support and Resistance levels: If a bullish crossover occurs right at a key support level, confidence in the

Moving Average Crossover قراءة المزيد »