PhillipCapital DIFC Research Team

Daily Market Updates june 4 thumbnail

Daily Market Updates – June 4

4 June 2026 – Daily Market Updates Markets Morning Briefing Big picture Risk tone softened overnight as tech hardware led global equities lower. US equity futures point to a weaker open, with growth and semiconductor-linked names under pressure. European stocks are tracking the move, while most Asian benchmarks finished in the red. Sovereign yields are little changed to fractionally lower as investors rotate toward safety. The US dollar is broadly steady against majors but firmer versus several Asian currencies. Crude oil is easing after a strong multi-week run, while gold is broadly flat. Digital assets are softer alongside the broader de-risking. What’s driving the tape AI enthusiasm vs. earnings reality: A prominent chip and infrastructure supplier offered a cautious near-term revenue outlook for AI-related hardware, prompting a pullback across the AI ecosystem. The theme remains intact longer term, but expectations and positioning are being recalibrated. Capacity constraints linger: Industry leaders continue to signal that advanced semiconductor production will remain tight relative to AI-driven demand for an extended period, keeping capex and supply-chain bottlenecks in focus. Deal calendar heats up: Investor education is picking up for several marquee listings across space and AI. A robust pipeline would bolster equity capital markets activity and bank fee pools, but it also introduces fresh supply for equities to absorb. Central bank watch: In Japan, speculation is building that policymakers could take another small step toward normalization in the months ahead, supporting the yen at the margin and stirring volatility across local rates. Elsewhere, US Treasury moves remain data-dependent with inflation still the swing factor. Geopolitics: Ongoing tensions in the Middle East are adding a layer of headline risk to energy and broader risk appetite. Regional and asset-class snapshot United States: Futures indicate a tech-led pullback. Defensive sectors (health care, utilities, staples) look relatively resilient pre-market. Traders are eyeing labor-market updates and services activity data for clues on growth and inflation momentum. Europe: Risk-off open with cyclicals and luxury names lagging; banks mixed as curves flatten modestly. Country-level inflation revisions and central-bank commentary are in focus. Asia: North Asia underperformed as semiconductor and hardware exposure weighed on benchmarks. Policymakers in parts of the region reiterated readiness to manage currency volatility. Rates: US 10-year yields hover near recent ranges; curves marginally flatter. In Europe, core yields are steady with peripheral spreads slightly wider. UK gilts remain sensitive to supply and domestic growth signals amid talk of broadening household participation in government bonds. Commodities: Oil slips on risk sentiment and position squaring after recent gains; refined products follow. Industrial metals consolidate amid uneven China demand signals. Precious metals are little changed as real yields and the dollar hold steady. FX: Dollar index is stable; yen trades firm on policy speculation; sterling is range-bound ahead of domestic data; select EM Asia FX under pressure as authorities emphasize vigilance. Crypto: Prices are lower with elevated realized volatility; positioning remains sensitive to macro liquidity and regulatory headlines. Expand Your Global Market Access Navigate international stock markets and secure tailored wealth management solutions backed by our local DIFC expertise. Discover Our Services Earnings and events to watch Corporate updates: A busy slate from software, cybersecurity, hardware, and consumer discretionary names will add micro drivers to a macro-led session. Data: US jobless claims, services/activity gauges, and productivity/costs updates are key for assessing the growth-inflation mix. Global PMI revisions and central-bank speakers may sway rates and FX. Themes for investors AI dispersion: The long-term AI buildout continues, but near-term winners and losers will be driven by supply constraints, customer mix, and power/compute availability. Expect periodic shakeouts around guidance. Quality vs. cyclicality: With rates elevated and growth moderating, balance-sheet strength and cash flow remain in favor, while deep cyclicals may trade more tactically. Duration balance: Treasuries retain hedging value on risk-off days, but sticky services inflation keeps the path of policy and term premia uncertain. Energy and volatility: Crude’s pullback follows a strong run; options markets imply continued two-way risk as geopolitics and inventories intersect. What’s next Focus tightens on the upcoming US inflation prints and any hints of policy shifts from major central banks. Watch the equity calendar: High-profile listings can lift sentiment but also test risk appetite as supply returns to primary markets. Monitor semiconductor headlines for updates on lead times, capacity additions, and power constraints that could shape the sector’s next leg. Trade Futures & Options on Regulated Exchanges Hedge against volatility and maximize capital efficiency with our expert-backed derivatives trading platforms. Explore Trading Products Disclaimer: Trading foreign exchange and/or contracts for difference on margin carries a high level of risk, and may not be suitable for all investors as you could sustain losses in excess of deposits. The products are intended for retail, professional and eligible counterparty clients. Before deciding to trade any products offered by PhillipCapital (DIFC) Private Limited you should carefully consider your objectives, financial situation, needs and level of experience. You should be aware of all the risks associated with trading on margin. The content of the Website must not be construed as personal advice. For retail, professional and eligible counterparty clients. Before deciding to trade any products offered by PhillipCapital (DIFC) Private Limited you should carefully consider your objectives, financial situation, needs and level of experience. You should be aware of all the risks associated with trading on margin. Rolling Spot Contracts and CFDs are complex instruments and come with a high risk of losing money rapidly due to leverage. 78% of our retail client accounts lose money while trading with us. You should consider whether you understand how Rolling Spot Contracts and CFDs work, and whether you can afford to take the high risk of losing your money. Daily Market Updates – June 4 June 4, 2026 3 June 2026 – Daily Market Updates Markets Morning Briefing:… Read More Daily Market Updates – June 3 June 3, 2026 3 June 2026 – Daily Market Updates Markets Morning Briefing:… Read More Daily Market Updates – June 2 June 2, 2026 2 June 2026 – Daily

Daily Market Updates – June 4 قراءة المزيد »

Support Resistance Bounce thumbnail

Support-Resistance Bounce

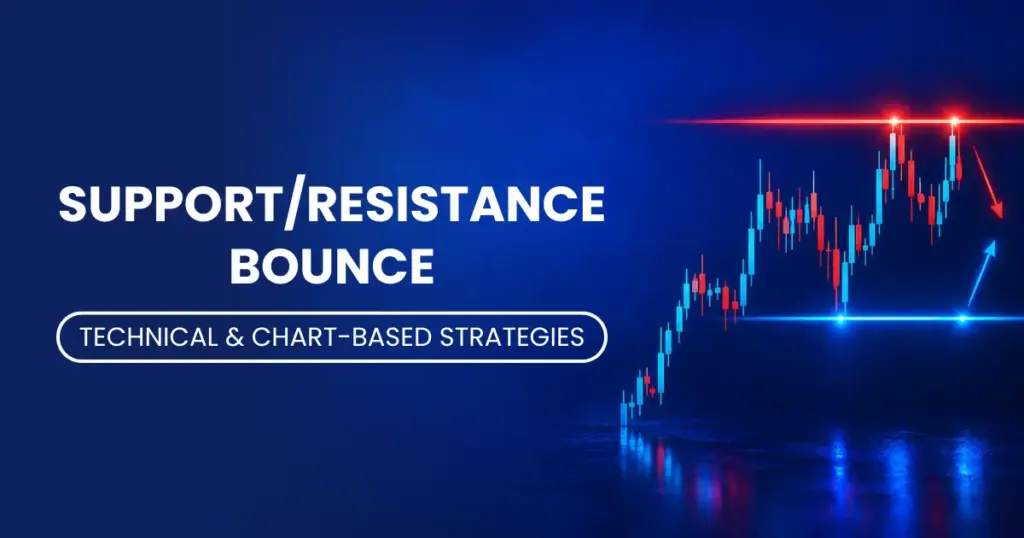
Support/Resistance Bounce Table of Contents Introduction What Is Support and Resistance in Trading? What Is a Support/Resistance Bounce? Why Do Prices Bounce at These Levels? How to Identify a Valid Bounce Setup on a Chart How Do You Enter and Exit a Bounce Trade? What Are the Risks and How Do You Manage Them? Conclusion & Key Takeaways Introduction Every price chart tells a story — and at the heart of that story are price levels where the market repeatedly pauses, reverses, or accelerates. These are support and resistance levels, and the strategy of trading a bounce off these levels is one of the most widely used approaches in technical analysis. Whether you trade global equities, forex pairs, or commodities, understanding how prices behave at these key zones can sharpen your timing, improve your entries, and reduce costly guesswork. This guide breaks down the support/resistance bounce strategy in plain language — explaining what it is, why it works, and how to apply it with discipline. What Is Support and Resistance in Trading? Support is a price level where a falling asset tends to pause or reverse upward. Think of it as a floor — buyers step in at this price, creating enough demand to stop further decline. Resistance is the opposite: a price ceiling where a rising asset tends to stall or pull back. At resistance, sellers become more active, outweighing buying pressure and capping the advance. These levels are not random. They form because of market memory — traders remember where prices reversed in the past and expect similar behavior in the future. Over time, this collective expectation becomes self-reinforcing. The more times a level holds, the more significant and reliable it becomes. Support and resistance levels appear across all asset classes and all timeframes — from a 5-minute forex chart to a monthly equities chart. They are the foundational building blocks of technical chart analysis and are used by retail traders, institutional desks, and algorithmic systems alike What Is a Support/Resistance Bounce? A support/resistance bounce is a trading strategy that seeks to profit from predictable price reversals at established support or resistance levels. In a support bounce, the price falls toward a known support zone, shows signs of slowing down (often with a reversal candlestick pattern), and then moves back upward. A trader enters a long (buy) position anticipating this upward reversal. In a resistance bounce, the price rises toward a known resistance zone, loses momentum, and turns lower. A trader enters a short (sell) position expecting the price to retreat. The logic is straightforward: if a price level has held multiple times in the past, there is a reasonable probability it will hold again. The bounce strategy is built on this probability — not certainty, but repeatable, testable behavior. This approach is particularly popular among traders who deal in CFDs and Spot FX, where short-term price swings offer frequent opportunities to apply bounce setups across currency pairs, indices, and commodities. Why Do Prices Bounce at These Levels? Understanding the why behind a bounce makes you a more confident trader — and less likely to abandon a setup at the first sign of volatility. Psychological Price Memory Markets are driven by human decisions. When a price level has previously caused a significant reversal, traders remember it. Buyers who missed the last bounce are ready to buy again. Sellers who lost at resistance will sell again. This collective behavior creates a self-fulfilling dynamic at key levels. Institutional Order Placement Large institutional participants — banks, funds, and asset managers — often place limit orders at historically significant price levels. When price reaches those zones, these large orders absorb selling (at support) or buying (at resistance), creating the bounce. Traders accessing global equity markets or futures markets will often see this effect most clearly around round numbers and multi-month highs and lows. Stop-Loss Clustering Many retail traders set stop-losses just below support or just above resistance. When price approaches these zones, the density of stop orders influences how the market reacts — often sharply, generating the bounce move that technical traders anticipate. Role Reversal Principle In technical analysis, a broken support level often becomes resistance, and a broken resistance level often becomes support. This “flip” creates fresh bounce opportunities when price returns to test the broken level from the other side. How to Identify a Valid Bounce Setup on a Chart Not every touch of a support or resistance level produces a clean bounce. Here’s how to assess whether a setup has genuine quality: Look for Multiple Touches A level that has been tested and held two or more times is far more significant than one that has only been touched once. The more tests a level has survived, the more institutional weight it carries. Confirm on a Higher Timeframe A support level visible on a weekly chart carries much more weight than one drawn on a 15-minute chart. Always check whether your setup aligns with higher timeframe structure — this dramatically improves the odds of a clean bounce. Watch for Reversal Candlestick Signals When price reaches a support or resistance zone, look for confirming candlestick patterns such as a pin bar (long wick rejecting the level), an engulfing candle, or a doji with follow-through. These patterns signal that the market has tested the level and rejected it — the core ingredient of a bounce trade. Assess the Approach — Gradual vs. Sharp A price that gradually drifts into support after a controlled pullback is more likely to bounce cleanly than one arriving after a near-vertical, panic-driven drop. The manner in which price arrives at the level matters. Use Volume as a Filter At genuine support levels, you often see a spike in volume as buyers step in. Declining volume on the approach to resistance followed by a surge on rejection can also validate the setup. Traders using futures and options often monitor volume closely alongside price action to confirm these setups. Trade CFDs Across Global Markets Apply support/resistance bounce

Support-Resistance Bounce قراءة المزيد »

Daily Market Updates june 3 thumbnail

Daily Market Updates – June 3

3 June 2026 – Daily Market Updates Markets Morning Briefing: Rotation in Asia, Oil Rebound, Policy Uncertainty Back in Focus Global markets are mixed as oil extends its advance, policy risks resurface, and investors continue to rotate within equities. Early price action shows a modest risk-off tone in stocks, firmer bond yields, and a stronger energy complex. Market at a glance (as of about 06:44 a.m. ET; levels are indicative) Brent crude: ~$98.50 (+2.6% on the session) S&P 500 futures: slightly lower Stoxx Europe 600: -0.4% Hang Seng: -1.6% Bitcoin: ~$67,200 (-0.4%) US 10-year Treasury yield: ~4.48% (+4 bps) Top themes we’re watching Energy-led reflation risk: Crude’s climb, aided by fresh geopolitical tensions in the Middle East, has pushed Brent closer to the psychological $100 mark. Sustained strength here can filter into inflation prints, cost pressures for energy-intensive industries, and renewed debate about the timing and pace of any future policy easing. Trade policy uncertainty: Fresh US tariff proposals aimed broadly across trading partners raise questions around supply chains, input costs, and currency moves. Export-heavy markets and cyclical manufacturers could see near-term volatility as details emerge. Asia equity rotation: Despite strong year-to-date gains in chip-centric benchmarks in Korea and Taiwan, recent cross-border flows indicate investors are favoring Japan. Drivers include market breadth, ongoing governance reforms, healthy buyback momentum, and currency dynamics. The concentration risk in a handful of semiconductor leaders remains a talking point for Korea/Taiwan, even as longer-term AI capital spending trends are still supportive. Liquidity in private markets: Reports of redemption gates and capped withdrawals at certain evergreen private credit and private equity vehicles highlight the persistent liquidity mismatch in less-frequented asset classes. Expect continued scrutiny of fund structures, NAV marks, and cash management practices. Global growth path: Forecast scenarios from multilateral institutions underscore that a prolonged geopolitical shock into next year could pressure world growth and push some economies toward the brink of recession. That keeps policy optionality, fiscal backstops, and commodity markets squarely in focus. Equities US: Futures point to a pause after recent record-setting runs. The AI supply chain remains the market’s structural leadership group, but earnings execution and cash flow durability are front and center for the next leg. Several large-cap technology, cybersecurity, healthcare, and travel/leisure names report today and after the close, which may set the tone for factor leadership this week. Europe: A softer open as energy strength meets broader multiple fatigue. Consumer and industrial bellwethers are trading on idiosyncratic catalysts, including deal activity and guidance updates. Asia: Japan remains the regional bright spot for foreign allocation given breadth and reform tailwinds. Select ASEAN markets are contending with currency weakness and outflows, while Greater China sentiment is cautious amid property and growth concerns. Rates and FX US Treasury yields are nudging higher alongside oil, reflecting a modest reappraisal of near-term inflation risk and term premium. The long end remains sensitive to supply dynamics and growth resilience. The dollar is firm on policy and growth differentials. Yen moves remain a swing factor for Japan equities and buyback math. In EM, pockets of currency pressure persist where external balances are tighter and terms of trade are less favorable. Commodities Oil: The bid in crude is being driven by supply-risk headlines and positioning. A sustained push above recent ranges would likely rekindle discussions about headline CPI stickiness and margin compression outside of energy producers. Metals: Gold and base metals are range-bound early; watch real rates and China growth signals for direction. Trade Global Commodities & Futures Hedge against inflation and geopolitical risks with seamless access to global energy and metal futures. Explore Futures Trading Digital assets Bitcoin trades softer as investors weigh ETF flow variability, tighter liquidity conditions, and the availability of alternative exposures (energy, gold, profitable AI beneficiaries). Correlations with tech have loosened, and macro sensitivity to real yields has been more visible. Earnings and events to watch Earnings: Notable reports in semiconductors, software/cybersecurity, medtech, and online travel could influence factor dispersion (quality, momentum) and broader risk tone. Macro: Keep an eye on the week’s labor data, services activity gauges, and central bank speakers for clues on growth and the inflation path. Policy: Any incremental detail on US tariff proposals and updates on Middle East developments remain key swing variables for commodities, FX, and cyclicals. Positioning considerations (not investment advice) Equity: Maintain focus on earnings visibility and balance sheet strength. The AI-capex cycle remains a secular support, but leadership is getting narrower; consider diversification across beneficiaries with proven operating leverage. Fixed income: Elevated oil and sticky services inflation argue for caution on duration at the margin. Short/intermediate tenors and barbell approaches can help navigate event risk. Commodities: Energy exposure acts as a hedge against geopolitical and inflation surprises; risk-manage around headline volatility. FX: Dollar strength tends to persist when US growth outpaces and policy stays relatively tighter. Yen sensitivity to policy and intervention talk remains high. Liquidity: For private-market allocations, reassess vehicle structures, redemption terms, and cash buffers in light of recent gating headlines. Risk radar Geopolitical escalation spilling into supply chains and commodities Trade/tariff announcements altering corporate cost structures Narrow market leadership and leverage in popular trades Liquidity in private vehicles versus redemption demands Data note: Market levels above are indicative snapshots from widely used pricing sources as of early US morning and may have moved since publication. Access Award-Winning Global Brokerage Execute your multi-asset strategies with the UAE’s premier institutional and retail broker. Discover Investment Products Disclaimer: Trading foreign exchange and/or contracts for difference on margin carries a high level of risk, and may not be suitable for all investors as you could sustain losses in excess of deposits. The products are intended for retail, professional and eligible counterparty clients. Before deciding to trade any products offered by PhillipCapital (DIFC) Private Limited you should carefully consider your objectives, financial situation, needs and level of experience. You should be aware of all the risks associated with trading on margin. The content of the Website must not be construed as personal advice. For

Daily Market Updates – June 3 قراءة المزيد »

Breakout Trading thumbnail

Breakout Trading

Breakout Trading Introduction Every experienced trader knows that markets don’t move in a straight line. Prices consolidate, compress, and build pressure — and then, at some point, they break. That moment of breaking out from a defined price range is what breakout traders live for. Breakout trading is one of the most widely used approaches in technical and chart-based analysis. It works across markets — whether you’re trading global equities, forex pairs, commodities, or futures contracts. The core idea is straightforward: when a price breaks beyond a well-established barrier with strong momentum, it often signals the beginning of a powerful directional move. This guide answers the most important questions about breakout trading in a practical, no-jargon way — so whether you’re a retail investor or an active market participant, you walk away with a clear and actionable understanding. Table of Contents What Is Breakout Trading? Why Do Breakouts Happen? What Chart Patterns Are Used in Breakout Trading? How Do You Confirm a Real Breakout vs. a False One? How Do You Set Entry Points in a Breakout Trade? How Should You Manage Risk in Breakout Trading? What Markets Are Best Suited for Breakout Trading? What Are the Common Mistakes Breakout Traders Make? Conclusion & Key Takeaways What Is Breakout Trading? Breakout trading is a strategy where a trader enters a position when the price of an asset moves beyond a clearly defined support or resistance level — on higher-than-average volume and with meaningful momentum. The assumption behind this strategy is that once a strong price barrier is breached, the asset will continue moving in the same direction, often for a sustained period. Think of it like a dam holding back water. As long as the dam holds, the water stays still. But once the dam breaks, the water moves — fast and powerfully. Breakout trading attempts to capture that surge. The levels traders watch most closely include horizontal resistance zones, trendline boundaries, chart pattern boundaries (such as triangles or flags), and round-number psychological levels. Why Do Breakouts Happen? Breakouts are a direct result of a shift in the balance between buyers and sellers in the market. Understanding the reason behind them helps traders make better decisions. Accumulation of orders: Near key price levels, a large number of limit orders (both buy and sell) tend to cluster. When price finally reaches and clears those levels, all those pending orders get triggered simultaneously, causing a rapid price move. News and fundamental catalysts: Earnings announcements, central bank decisions, or macroeconomic data releases often provide the trigger for a breakout. These events shift trader sentiment sharply in one direction. Institutional activity: Large funds and institutions often push prices through resistance levels when entering or exiting major positions. Retail traders tracking CFDs and Spot FX can often observe these footprints through volume spikes accompanying the breakout. Market sentiment: Sometimes a breakout reflects nothing more than a collective change in how the crowd perceives an asset’s value. Momentum feeds momentum. What Chart Patterns Are Used in Breakout Trading? Certain chart formations are particularly well-suited for breakout setups because they visually represent price compression or consolidation before a potential explosive move. Triangles (Ascending, Descending, and Symmetrical) Triangles are among the most reliable breakout patterns. In an ascending triangle, price makes higher lows while resistance stays flat — signalling increasing buying pressure. A breakout above that flat resistance line is the trigger. Descending triangles show the opposite. Symmetrical triangles indicate indecision and often break in the direction of the prevailing trend. Rectangles and Trading Ranges When price bounces repeatedly between two horizontal levels — a ceiling (resistance) and a floor (support) — it forms a rectangle. Breakout traders wait for price to close convincingly outside this range before entering. Flags and Pennants These are short-term continuation patterns. After a strong initial move (the “flagpole”), price consolidates briefly in a tight range before continuing. The breakout from the flag or pennant is the entry trigger. Cup and Handle Common in stocks, this pattern shows a rounded bottom followed by a small consolidation. The breakout above the handle’s resistance is the entry point — often associated with strong upward follow-through. Traders applying these patterns across global stocks and ETFs can use them on daily or weekly charts for higher-probability setups. How Do You Confirm a Real Breakout vs. a False One? This is arguably the most important skill in breakout trading. False breakouts — also called “fakeouts” — are very common. Price briefly moves beyond a level, triggers entries, and then reverses sharply, trapping traders on the wrong side. Volume is the most important confirmation tool. A genuine breakout should be accompanied by a clear surge in trading volume. If volume is weak or average when the price breaks a level, be cautious. High volume indicates genuine participation from the market — not a temporary spike. Wait for a candle close. Many breakout traders require the price candle to close beyond the level — not just pierce it — before entering. This simple filter eliminates a significant number of false signals. Retest confirmation: After a breakout, price often pulls back briefly to “retest” the broken level — which now acts as new support (for an upside breakout) or resistance (for a downside breakout). Entering on this retest is a lower-risk approach than entering at the initial break. Multi-timeframe alignment: If the breakout appears on a daily chart and the weekly chart also shows the same directional momentum, confidence in the trade increases significantly. Traders using Futures & Options need particularly sharp breakout confirmation skills, since leverage amplifies both gains and losses. Trade Global Markets Through a Regulated Dubai Broker Access stocks, CFDs, futures, and forex with professional-grade execution Open a Trading Account How Do You Set Entry Points in a Breakout Trade? Timing your entry correctly is the difference between a profitable breakout trade and buying into a fakeout at the worst possible price. Entry Method 1 – Breakout Entry (Aggressive): Place a buy stop order just above the

Breakout Trading قراءة المزيد »

Daily Market Updates june 2 thumbnail

Daily Market Updates – June 2

2 June 2026 – Daily Market Updates Global Markets Morning Briefing As of 06:35 AM ET Brent crude futures: $94.04 (-1.0%) S&P 500 futures: 7,603.25 (-0.1%) Stoxx Europe 600: 625.76 (+0.7%) Hang Seng: 26,038.32 (+2.5%) Kospi: 8,801.49 (+0.1%) US 10-year Treasury yield: 4.43% (-2 bps) Market data subject to provider delays. Top Takeaways Equity tone: After a strong multi-session advance led by AI beneficiaries, US equity futures are marginally softer, while Europe is firmer and most of Asia closed higher with notable strength in Hong Kong. Rates and FX: Treasury yields are little changed, holding near the mid-4% range on the 10-year as investors balance firm activity data against moderating inflation trends. The dollar remains supported by growth differentials and haven flows. Commodities: Oil is steady-to-softer after recent gains, with markets weighing supply risks around key shipping lanes against demand signals. Tightness is evident across parts of the commodity complex, and drawdowns in inventories are in focus. Primary markets in focus: A wave of mega-sized equity issuance and listings tied to AI and digital infrastructure is reportedly lining up, potentially totaling hundreds of billions of dollars over the coming quarters. This will test risk appetite and price discipline across the broader market. Europe macro: Recent euro-area inflation readings re-accelerated, reinforcing expectations for near-term policy action and keeping front-end rates sensitive to data surprises. The Big Theme: An AI-Era Capital Raise Multiple high-profile technology and AI-adjacent companies are preparing substantial equity financings and potential listings. The scale is large enough to matter for market breadth, factor leadership, and liquidity. Key debate: Could new supply crowd out demand for the rest of the market? Countervailing forces include elevated corporate buybacks, continued inflows into equity funds, and robust retail participation in thematic exposures. What to watch: Pricing discipline for high-growth, cash-burning stories versus profitable compounders. Allocation effects on non-AI sectors if demand clusters around a few marquee deals. Follow-on activity from established tech platforms to fund capex-intensive AI buildouts. Convertible issuance and hybrid structures as rate volatility stays elevated. Sector and Style Check Semiconductors and AI infrastructure: Ongoing optimism around compute demand, networking, and optics. Companies leveraged to data-center buildouts continue to see strong interest. Megacap tech: Headlines around prospective capital raising can introduce near-term volatility even as longer-term AI investment cases remain intact. Hardware and enterprise IT: Positive guidance tied to AI server demand and accelerated infrastructure cycles is supporting select names. Health care and biotech: Stock-specific clinical readouts are driving dispersion; risk management around binary outcomes remains essential. Financials in Europe: Consolidation dynamics continue to percolate, with cross-border interest and scale benefits back in the conversation. Rates, Credit, and Liquidity Government bonds: Range-bound trading persists as markets await the next catalysts from inflation, growth, and labor prints. Term premium remains a swing factor. Credit: Primary issuance windows are open; investor demand is healthy for high-quality paper. Watch for opportunistic refinancing and potential uptick in converts alongside equity supply. Liquidity: If the equity calendar becomes crowded, expect concessions on later deals, greater selectivity, and potentially wider intra-day swings around bookbuilds. Trade Global Futures & Options Manage risk and capture opportunities with seamless access to over 15 global exchanges directly from the DIFC. Explore Futures Contracts Commodities and Geopolitics Energy: Price action reflects a tug-of-war between supply disruptions near strategic chokepoints and concerns that higher prices could cool demand. Inventory trends and time spreads remain key signals. Metals: Structural demand for copper and related inputs from electrification and data centers is a supportive medium-term theme; near-term moves remain data- and China-sensitive. Agriculture: Weather risks are on the radar, with the potential for yield variability to affect price volatility. Digital Assets Sentiment cooled, with the largest token slipping below a widely watched round-number threshold. Macro rates and liquidity conditions continue to drive cross-asset beta, including crypto. Positioning Considerations (not investment advice) Maintain diversification: AI leadership has been powerful, but breadth can matter if issuance crowds the top end of the market. Mind liquidity: Stagger entries around large deal calendars; be patient on price in crowded themes. Balance growth and quality: Focus on cash flow visibility, unit economics, and capex intensity. Duration risk: Keep an eye on rate sensitivity in equity and credit exposures as yields consolidate. Hedging: Consider volatility overlays around macro prints and large capital-raising events. What’s Next Deal calendar: Monitor filings, price talk, and initial allocations for upcoming offerings tied to AI and infrastructure. Policy watch: Central bank communications in the US and Europe, with inflation prints steering near-term paths. Data pulse: Growth, labor, and earnings revisions will set the tone for risk appetite into mid-month. Institutional-Grade Brokerage Services Leverage world-class infrastructure and deep liquidity tailored specifically for funds and family offices. Discover Institutional Services Disclaimer: Trading foreign exchange and/or contracts for difference on margin carries a high level of risk, and may not be suitable for all investors as you could sustain losses in excess of deposits. The products are intended for retail, professional and eligible counterparty clients. Before deciding to trade any products offered by PhillipCapital (DIFC) Private Limited you should carefully consider your objectives, financial situation, needs and level of experience. You should be aware of all the risks associated with trading on margin. The content of the Website must not be construed as personal advice. For retail, professional and eligible counterparty clients. Before deciding to trade any products offered by PhillipCapital (DIFC) Private Limited you should carefully consider your objectives, financial situation, needs and level of experience. You should be aware of all the risks associated with trading on margin. Rolling Spot Contracts and CFDs are complex instruments and come with a high risk of losing money rapidly due to leverage. 78% of our retail client accounts lose money while trading with us. You should consider whether you understand how Rolling Spot Contracts and CFDs work, and whether you can afford to take the high risk of losing your money. Daily Market Updates – June 2 June 2, 2026 2 June 2026 – Daily Market Updates Global

Daily Market Updates – June 2 قراءة المزيد »

Mean Reversion thumbnail

Mean Reversion

Mean Reversion Table of Contents Introduction What Is Mean Reversion in Trading? What Is the Core Idea Behind Mean Reversion? Which Indicators Are Used for Mean Reversion? What Markets Work Best for Mean Reversion? What Are the Key Risks? Conclusion & Key Takeaways Introduction Every trader has watched a stock shoot up 15% in a week — only to fall right back to where it started. Or seen a currency pair collapse on bad news, then quietly recover within days. That “rubber band” effect is not random. It is the principle of mean reversion at work. Mean reversion is one of the most widely used chart-based strategies in professional trading. It does not rely on predicting the future direction of a market — instead, it bets on a simple, observable truth: prices that stray too far from their average tend to come back. Understanding how to identify and trade these setups can give both retail and institutional investors a consistent, rules-based edge. What Is Mean Reversion in Trading? Simply put: if a price moves too far from its “normal” level, it will likely return to that level over time. Every asset — whether a stock, a currency pair, a commodity, or an index — trades around an average price over any given period. That average acts like a gravitational centre. When news, sentiment, or a spike in volume pushes the price far above or below that centre, the market tends to self-correct. This is what traders call mean reversion: the tendency of an asset’s price to move back toward its historical average after an extreme move. The “mean” here refers to the statistical average of prices over a defined lookback period — commonly 20, 50, or 200 days. The further an asset drifts from this average, the stronger the pull back toward it is expected to be. What Is the Core Idea Behind Mean Reversion? The strategy is built on identifying “overextended” price moves — and trading the return journey. When a market is moving normally, its price stays relatively close to its moving average. But extreme moves — triggered by earnings surprises, geopolitical events, or panic selling — can push prices to levels that are statistically unusual. Mean reversion traders look for these extremes and position themselves for the correction. Here is how the logic works in practice: A stock rises 20% in three days with no change in fundamentals → it may be overbought → a mean reversion trader may consider shorting or waiting for a reversal signal. A currency pair drops sharply on a rumour that is later denied → the market overcorrected → a mean reversion trader might look for a long entry near strong support. The strategy works across different time frames. Day traders use it on 5-minute or 15-minute charts. Swing traders apply it over days or weeks. Long-term investors may use it to find entry points in fundamentally strong assets that have temporarily sold off. If you are exploring trading strategies more broadly, understanding both trend-following and mean reversion approaches gives you a more complete toolkit. Which Indicators Are Used for Mean Reversion? The most effective mean reversion traders don’t rely on guesswork — they use specific technical indicators to identify stretched conditions. Bollinger Bands Bollinger Bands plot two standard deviation lines above and below a moving average. When price touches or breaks the upper band, the asset may be overbought. When it touches the lower band, it may be oversold. Mean reversion traders look for price to revert back toward the middle band (the 20-day moving average). Relative Strength Index (RSI) RSI measures the speed and magnitude of recent price moves on a scale of 0 to 100. Readings above 70 suggest overbought conditions; readings below 30 suggest oversold conditions. In a mean reversion context, traders watch for RSI to cross back from extreme territory as a confirmation signal before entering a trade. Moving Average Deviation This measures how far the current price sits from its moving average — usually expressed as a percentage. A stock trading 10–15% above its 50-day moving average, for example, may be a candidate for mean reversion. Some traders combine this with volume data to add conviction. Z-Score Used more by quantitative traders, the Z-score standardises the distance between current price and the mean in terms of standard deviations. A Z-score above +2 or below -2 suggests a significant deviation — and a potential reversion opportunity. No single indicator should be used alone. The strongest mean reversion setups combine multiple signals — for example, RSI below 30 alongside a price touching the lower Bollinger Band and a bullish candlestick pattern. Traders who also understand derivatives basics can use options strategies alongside mean reversion signals to manage downside risk more effectively. Trade CFDs with Precision Tools Apply mean reversion strategies across global markets using leveraged CFDs Explore CFD Trading What Markets Work Best for Mean Reversion? Mean reversion performs best in range-bound markets and with liquid, well-established assets. Equities (Stocks & ETFs) Individual stocks — particularly blue-chip or large-cap stocks — exhibit strong mean reversion tendencies, especially after earnings-driven spikes or macro-driven sell-offs. US stocks, ETFs, and ADRs are among the most liquid and data-rich environments for applying this strategy. ETFs are particularly well-suited because they represent diversified baskets of assets, reducing the chance of a permanent fundamental shift distorting the mean. Forex (Currency Pairs) Currency pairs often revert to mean after sharp, news-driven moves — particularly major pairs like EUR/USD or USD/JPY. Because forex basics involve two economies in a constant balance, temporary dislocations are common. Carry trade unwinds, central bank policy surprises, and geopolitical headlines regularly cause short-lived overextensions that mean reversion traders can exploit. GCC Equities Regional equity markets — including stocks listed on the Dubai Financial Market and Abu Dhabi Securities Exchange — can also show mean reversion patterns, particularly around dividend cycles or quarterly reporting periods. Traders interested in GCC stocks may find this strategy useful for timing entries in quality regional

Mean Reversion قراءة المزيد »

Daily Market Updates june 1 thumbnail

Daily Market Updates – June 1

1 June 2026 – Daily Market Updates Morning Markets Brief: Mega-Listings Shift the Playbook Overview US equity futures are modestly higher, pointing to a steady start after recent highs. Tech remains the driver as investors lean into the AI and data-center buildout. Oil is firmer, with Brent hovering in the mid-$90s amid supply headlines and lingering geopolitical risk—supporting energy shares but complicating the inflation outlook. The US 10-year Treasury yield is edging up around the mid-4% area as markets weigh resilient growth against a slow path for disinflation. Asia was broadly constructive overnight, led by Japan and Korea, as investors rotate toward technology and growth stories. Theme of the Day: The “Mega-IPO” Ripple Effect A forthcoming blockbuster listing from a leading space, satellite, and AI-infrastructure company is prompting a rare, market-wide reset: Index rules: Benchmark providers are adapting inclusion criteria to accommodate outsized new entrants, which could accelerate the path from IPO to index membership for large-cap newcomers. Passive flows: Quant teams at index and passive managers are modeling sizable buy-on-inclusion demand—important for liquidity planning across desks. ETFs and wrappers: Issuers are preparing thematic and broad-based vehicles that may feature the new name quickly after listing, seeking to capture investor appetite without concentrated single-stock risk. Retail interest: Pre-IPO/secondary vehicles and structured access products are seeing heightened activity, underscoring demand for exposure but also highlighting liquidity, valuation, and due-diligence risks. Portfolio takeaway: An offering of this scale can temporarily absorb market liquidity and create cross-asset knock-on effects (funding, hedging, and sector rotations). Traders should be mindful of settlement calendars, potential index-tracking adjustments, and short-term volatility around pricing and allocation. Equities: Rotations Beneath the Surface AI into PCs: Announcements around next-gen PC platforms that pair advanced CPUs with accelerated computing are reshaping expectations for the PC refresh cycle. Chipmakers are diverging as the market handicaps winners in AI-enabled laptops, while select hardware OEMs continue their recent rebound on the prospect of demand tailwinds. Japan leadership: A tech-led advance has helped keep Japanese equities supported, with market leadership rotating toward platforms and holdings levered to AI infrastructure and connectivity. Corporate activity: Large-cap M&A is stirring in housing and other cyclicals, hinting at confidence in medium-term demand even as financing costs remain elevated. Europe watch: Travel and transport names remain sensitive to fuel costs and uneven demand, while financials and energy are buoyed by higher rates and oil respectively. Rates and Credit US yields continue to reflect a “higher for longer, but data dependent” stance. Front-end rates are pinned by policy expectations; the long end is adjusting to growth resilience and fiscal supply. Credit spreads remain broadly contained, supported by healthy earnings and ample liquidity. Primary markets are active but selective, with investors favoring balance-sheet discipline and clear cash-flow visibility. Commodities and Currencies Energy: Crude’s climb is supporting producers and services, but prolonged strength could re-ignite inflation anxieties and complicate rate-cut timelines. FX: Dollar tone is mixed, balancing firmer US data against improving growth signals in parts of Asia. Higher oil can be a headwind for energy importers and a tailwind for exporters. Positioning and Flows Cash balances in liquidity funds are near record territory, reflecting attractive short-term yields and a preference for optionality. This “dry powder” can cushion drawdowns but also cap upside if investors stay sidelined during risk-on stretches. Hedge fund activity has tilted more constructive in recent weeks, with net buying focused on tech and AI beneficiaries while trimming crash hedges—raising the importance of disciplined risk management into data and event risk. The Week Ahead: What Matters US: ISM manufacturing and services, JOLTS, factory orders, and the Fed’s Beige Book culminate in Friday’s jobs report (payrolls, jobless rate, wages). Labor tightness versus disinflation remains the core debate for the policy path. Euro Area: Flash inflation, retail sales, and producer prices will test the case for measured central-bank easing into the summer. Asia-Pacific: Australia GDP and a run of regional inflation and spending data offer a read on domestic demand and policy trajectories. What to watch: Any upside surprise in US labor or services inflation could nudge yields higher and challenge duration-sensitive equities; softer prints would likely support rate-cut hopes and risk assets. Strategy Thoughts Liquidity management: With a mega-offering approaching, consider settlement timing and temporary cash needs. Short-duration instruments remain a useful parking place for capital without sacrificing yield. Barbell in equities: Pair secular AI infrastructure beneficiaries (chips, networking, power, select OEMs) with quality cyclicals tied to construction, logistics, and industrial automation. Maintain diversification across regions to balance currency and policy risks. Energy hedge: Elevated oil supports energy equities and cash flows; offsetting exposure elsewhere can help manage inflation and rate surprises. Risk controls: Into payrolls and index rebalancing windows, tighten stops and reassess factor exposures (momentum, size, quality) to avoid unintended concentration. Navigate Market Volatility with Precision Leverage futures and options strategies to manage risk and capitalize on shifting sector rotations. Trade Futures & Options Key Risks Re-acceleration in inflation driven by services or energy. Liquidity drain or short-term dislocations around oversized equity issuance and index changes. Geopolitical flare-ups with spillovers to commodities and supply chains. Policy surprises if growth or jobs data materially diverge from trend. Bottom Line Markets are leaning risk-on, but the combination of a landmark listing, firm energy prices, and a data-heavy week argues for disciplined positioning. Stay nimble around event risk, keep cash deployment staggered, and maintain balance between secular growth themes and cyclical resilience. Disclaimer: Trading foreign exchange and/or contracts for difference on margin carries a high level of risk, and may not be suitable for all investors as you could sustain losses in excess of deposits. The products are intended for retail, professional and eligible counterparty clients. Before deciding to trade any products offered by PhillipCapital (DIFC) Private Limited you should carefully consider your objectives, financial situation, needs and level of experience. You should be aware of all the risks associated with trading on margin. The content of the Website must not be construed as personal advice. For retail, professional and eligible

Daily Market Updates – June 1 قراءة المزيد »

Momentum Trading thumbnail

Momentum Trading

Momentum Trading Table of Contents What Is Momentum Trading? How Does Momentum Trading Work in Practice? What Are the Key Indicators Used in Momentum Trading? What Markets Are Best Suited for Momentum Trading? What Are the Risks of Momentum Trading? How Do You Build a Simple Momentum Trading Plan? Conclusion & Key Takeaways Introduction Markets rarely move in straight lines — but when a strong trend takes hold, experienced traders know how to make it work in their favour. Momentum trading is one of the most widely used approaches in technical analysis, built on a straightforward idea: assets that have been rising tend to keep rising, and those falling tend to keep falling — at least for a while. Whether you trade global equities, CFDs, or futures, understanding momentum can give you a meaningful edge. This guide breaks down everything you need to know — in plain language — so you can evaluate whether this strategy fits your trading style. What Is Momentum Trading? In physics, momentum means an object in motion stays in motion. In financial markets, the concept works similarly. Momentum trading is a strategy where traders buy assets that are trending upward (or sell/short those trending downward), with the expectation that the trend will continue for a period before reversing. Rather than predicting where a price will go based on company fundamentals, momentum traders focus on where a price is already going, using historical price movement and volume as their guide. It is a core part of technical and chart-based trading strategies, sitting alongside approaches like breakout trading and moving average crossovers. The strategy became widely recognised in the 1990s when academic research confirmed that stocks with strong recent performance tended to outperform over the following months. Today, it is used across stocks, forex, commodities, and derivatives markets globally. How Does Momentum Trading Work in Practice? Suppose a stock has risen 15% over the past three weeks on high volume. A momentum trader does not ask “is this company worth buying at this price?” — they ask “is this uptrend strong enough to continue?” If indicators confirm strength, they enter the trade, ride the trend, and exit when signs of slowdown appear. The typical process looks like this: Identify a trending asset using price action and volume Confirm momentum using technical indicators (see next section) Enter the trade in the direction of the trend Set a stop-loss to protect against sudden reversals Exit when momentum weakens or a reversal signal appears Timing matters greatly. Entering too early — before momentum is confirmed — or too late — after the trend has exhausted itself — can result in poor returns. This is why traders pair momentum signals with disciplined risk management. For traders accessing global equities, momentum opportunities appear frequently on platforms offering US stocks and ETFs and global non-US equities, where diverse market conditions create multiple trend-following opportunities across sectors and geographies. Ready to Trade Global Markets? Access trending stocks, ETFs, and global equities through a regulated broker in Dubai. Explore Global Equities What Are the Key Indicators Used in Momentum Trading? Several technical indicators are specifically designed to measure the speed and strength of price movement. Here are the most commonly used: Relative Strength Index (RSI) RSI measures how quickly prices are moving in one direction. It ranges from 0 to 100. Readings above 70 suggest an asset may be overbought (strong upward momentum), while readings below 30 suggest oversold conditions (downward momentum). Momentum traders often use RSI to confirm that a trend has real strength before entering. Moving Average Convergence Divergence (MACD) MACD compares two moving averages of price to show momentum direction and potential crossovers. When the MACD line crosses above the signal line, it often indicates building upward momentum — a potential buy signal. When it crosses below, the opposite may be true. Rate of Change (ROC) This indicator simply measures how much a price has changed over a set period. A rising ROC confirms accelerating momentum; a falling ROC may suggest the trend is losing steam. Volume Volume is not an oscillator, but it is vital. Strong momentum should be backed by increasing volume. If a price is rising but volume is declining, the trend may be fragile and prone to reversal. Understanding these tools is part of a broader foundation in stock market basics and fundamental analysis, which together help traders make more informed decisions about when momentum signals are reliable. What Markets Are Best Suited for Momentum Trading? Does momentum trading work in all asset classes? Momentum strategies can be applied across virtually every major asset class, but they tend to be most effective in liquid markets with clear, sustained trends. Equities: Individual stocks and sector ETFs are among the best environments for momentum trading. Growth sectors like technology or energy often produce extended trends that momentum traders can capitalise on. Accessing GCC stocks alongside global markets gives traders exposure to region-specific momentum cycles. Futures & Commodities: Commodity markets — oil, gold, agricultural products — frequently exhibit strong directional trends driven by macroeconomic forces. Futures and options trading allows traders to access these momentum-driven opportunities with leverage and precision. CFDs and Spot FX: The forex market runs 24 hours a day and produces momentum cycles tied to central bank decisions, economic data, and geopolitical developments. CFD trading gives traders the ability to go long or short on hundreds of instruments, making it flexible for both upward and downward momentum plays. Trade Momentum Across Asset Classes From CFDs to futures and global equities — all in one place. View Our Trading Products What Are the Risks of Momentum Trading? Is momentum trading as straightforward as it sounds? Momentum trading has real advantages — but it also carries significant risks that every trader must understand before committing capital. Trend Reversals: The biggest risk is entering a trade just as a trend is running out of energy. Markets can reverse sharply, especially around major economic announcements or unexpected news events. Momentum signals

Momentum Trading قراءة المزيد »

Weekly global Market news june week 1 thumbnail

Weekly Global Market News– June–Week 1

Weekly Global Market News – June – Week – 1 The Week Ahead: Macro, markets and milestones (May 31–June 7) Big picture Europe’s geopolitical calendar drives the early narrative. EU leaders are set to court western Balkan countries at a summit in Tivat, Montenegro, as Brussels pushes forward on broader enlargement, with progress on Ukraine and Moldova’s accession process expected to feature later in June. Expect headlines to influence EU risk sentiment, peripheral spreads and the euro through the week. Politics meets commodities in Latin America: Peru’s presidential run-off arrives as the copper-heavy economy faces a finely balanced contest. Copper price volatility and Peru-exposed miners could see outsized moves around preliminary results. AI hardware remains the equity market’s heartbeat. Computex in Taipei will showcase roadmaps from Nvidia and other chipmakers, keeping attention on supply chains, inference at the edge and data-center capex. Central bankers are busy but data are light until Friday’s US jobs report. Global PMIs and EU inflation flash prints set the tone for bonds and FX earlier in the week. Five market themes to watch AI supply chain breadth: Keynotes from Nvidia, Marvell, Intel and Qualcomm at Computex should reinforce visibility on accelerators, networking, packaging and software stacks. Watch semicap, substrates, HBM memory, and power/thermal names for read-through. European risk premium: A constructive EU–Balkans message could be mildly supportive for EUR assets, while any adverse Ukraine headlines maintain a safety bid for core rates. Keep an eye on BTP–Bund spreads. UK rates narrative: Bank of England governor Andrew Bailey speaks several times this week, including testimony to the House of Lords Economic Affairs Committee. Markets will parse remarks for timing cues on the first rate cut amid easing services inflation but sticky wage dynamics. US labor puzzle: Friday’s nonfarm payrolls, unemployment rate and earnings will shape the June/July Fed path. Hot wages plus firm payrolls would back “higher-for-longer”; cooling breadth or hours worked would lean dovish. Dollar, front-end yields and Big Tech factor leadership are the swing variables. Energy into OPEC+: Ministers from OPEC and partners meet Sunday. With inventories comfortable and demand signals mixed, attention centers on duration and depth of voluntary cuts. Brent time-spreads and refining margins will telegraph how the market reads the decision. Geopolitics and policy diary EU–Western Balkans tour and summit (all week; summit Friday, Tivat): Engagement with Bosnia and Herzegovina, Albania, North Macedonia, Kosovo and Serbia. Look for signals on accession timetables, infrastructure funding and energy integration. Kosovo parliamentary vote (Sunday): Political stability and EU dialogue posture are in focus. Peru presidential run-off (Sunday): Market angle via copper, sovereign spreads and local FX. US: Israel–Lebanon ceasefire talks expected to resume (Tuesday), potential Middle East risk sentiment ripple. Russia: St Petersburg International Economic Forum begins (Wednesday) — occasional headlines on energy and trade. OPEC+ ministerial meeting (Sunday). Central banks and speakers Bank of England: Gov Andrew Bailey testifies to House of Lords Economic Affairs Committee (Tuesday); speaks at Investment Association conference (Thursday); appears at Adam Smith “Wealth of Nations” anniversary event (Friday). MPC member Megan Greene speaks on inflation risks (Tuesday). Bank of Japan: Gov Kazuo Ueda addresses the Kisaragi-kai meeting (Wednesday) — yen sensitivity to any nuance on QT and rate-path guidance. Federal Reserve: Cleveland Fed President Beth Hammack (Tuesday). Beige Book released (Wednesday). ECB: Boris Vujčić begins his term as ECB vice-president (Monday). Macro data highlights Monday Global: S&P Global manufacturing PMIs (US, eurozone, UK, Japan, China, India and others) Euro area: Unemployment (Apr) Switzerland: Q1 GDP (est.) UK: Nationwide House Price Index Tuesday Euro area: Flash HICP (May) US: JOLTS job openings (Apr) Wednesday Global: S&P Global services PMIs Australia: Q1 GDP US: Beige Book Thursday Switzerland: CPI (May) Euro area/UK: Construction PMIs US: Q1 productivity and unit labor costs (rev.) Friday US: Nonfarm payrolls, jobless rate, average hourly earnings (May) EU: Q1 GDP (update) Canada: Labour force survey (May) India: Q4 GDP and policy decision UK: Halifax House Price Index France: Industrial production (Apr) Corporate events and earnings to note Semiconductors/AI: Computex (Taipei, from Tuesday). Nvidia’s Jensen Huang headlines; watch for partner announcements on Ethernet/InfiniBand, custom silicon, and AI PCs. Streaming/media: Netflix AGM (Thursday) — co‑founder Reed Hastings to step down as chair, capping the succession transition. Focus on ad-tier traction, password-sharing enforcement durability, and content efficiency. Transports: FedEx Freight begins trading post-separation (Monday) — implications for US freight multiples and LTL pricing. Insurance and staples: AIG CEO handover to Eric Andersen (Monday). Conagra Brands names John Brase CEO (Monday). Earnings and updates (selected) Monday Hewlett Packard Enterprise (Q2) Credo (Q4/FY) Sirius Real Estate (FY) Tuesday British American Tobacco (HY pre-close) Dollar General (Q1) GB Group (FY) Palo Alto Networks (Q3) Wednesday Broadcom (Q2) CrowdStrike (Q1) Inditex (Q1) B&M European Value Retail (FY) Five Below (Q1) Medtronic (Q4) Veeva Systems (Q1) Thursday Lululemon Athletica (Q1) Brown‑Forman (Q4/FY) Rémy Cointreau (FY) Ciena (Q2) Guidewire (Q3) Cooper Companies (Q2) Rubrik (Q1) Samsara (Q1) CMC Markets (FY) Mitie (FY) Friday Saputo (Q4/FY) Sekisui House (Q1) Asset class snapshot — what matters now Equities: AI leadership remains intact; breadth should improve if PMIs stabilize and yields stay range-bound. Retail and luxury names will take their cue from US discretionary prints and Inditex’s gross margin commentary. Defensive staples watchlist: pricing vs volumes into H2. Rates: US front end is data-dependent into NFP; a soft print would likely bull-steepen. Gilts sensitive to Bailey/Greene tone on services inflation. Swiss CPI could tweak local curve expectations. FX: USD bid on strong payrolls; EUR reacts to HICP and EU risk headlines; JPY volatility around Ueda’s remarks — any hint of earlier balance-sheet normalization would support yen. Commodities: Copper volatility around Peru vote; oil curves attentive to OPEC+ guidance on voluntary cuts and quota compliance. Gold remains tethered to real yields and geopolitics. Global Legacy, Local Strength Explore seamless global market access and investment excellence right from the DIFC. Discover What We Offer What’s new in leadership and policy ECB: Boris Vujčić starts as vice-president (8‑year term), succeeding Luis de Guindos — continuity message expected. Corporate leadership:

Weekly Global Market News– June–Week 1 قراءة المزيد »

Daily Market Updates may 29 thumbnail

Daily Market Updates – May 29

29 May 2026 – Daily Market Updates Market Brief: May’s Rally Defies Seasonal Weakness; Global Risk Appetite Broadens Overview The longstanding market adage that equities tend to struggle from May through summer has been upended this year. Major US benchmarks are hovering near record territory into month-end, with technology leadership intact and volatility muted. The advance has been supported by resilient earnings, accelerating investment in artificial intelligence infrastructure, and an improved geopolitical tone in the Middle East. Gains have not been confined to the US: European shares are edging toward highs, and parts of Asia have surged on semiconductor strength and upgraded growth prospects Equities United States: Large-cap indices are pacing for a robust May and a multiweek winning streak, with megacap tech continuing to anchor performance. Participation beyond the very largest names has improved modestly, though leadership remains concentrated in AI, chips, and compute infrastructure. Traders note that as new highs persist and realized volatility stays subdued, the conversation is shifting from hedging to how sidelined cash may re-enter on dips. Europe: Regional equities are firmer into month-end and within reach of prior peaks. A mix of defensive and cyclicals is participating, even as fresh inflation readings on the continent complicate the near-term policy outlook. Asia: North Asia is leading global gains. Semiconductor and hardware names tied to AI buildouts have driven sharp advances, particularly in Korea and Japan. Elsewhere, optimism around tech demand has underpinned brighter growth forecasts in parts of the region. Ready to Navigate Global Markets? Gain seamless access to global stocks, ETFs, and derivatives with our institutional and retail brokerage services. Explore Trading Products Rates and Credit US Treasuries: Yields are broadly steady in the belly and long end into month-end, with the 10-year hovering in the mid‑4% area. Markets are balancing firm activity data and sticky components of inflation with evidence of easing supply pressures and softer energy. The front end remains sensitive to incoming price readings and labor data. Europe and UK: Firmer inflation prints in select countries have nudged expectations toward tighter policy risks than previously assumed. Curves remain choppy as traders reassess the timing and extent of any additional moves from major central banks. Credit: Primary issuance has been active into the final stretch of May, helped by risk-on sentiment. Spreads are largely stable, with higher-beta segments outperforming on the week. Commodities Energy: Crude is lower into month-end despite lingering geopolitical risk, as supply expectations and improved cease-fire prospects dampen the war premium. Brent is trading around the low-$90s, on course for a sharp monthly decline after a strong run earlier in the spring. Metals: Industrial metals are mixed as investors weigh resilient demand against a firmer US dollar. Precious metals are steady to softer on improved risk appetite. Currencies and Digital Assets FX: The dollar is modestly stronger on the month, supported by relative US rate expectations. That said, improved risk sentiment and the prospect of relatively tighter policy paths outside the US limit follow-through. European currencies found some footing as traders repriced local inflation risks. Crypto: Major tokens have eased from recent highs, with sentiment tracking broader liquidity conditions rather than policy headlines. Corporate Highlights AI infrastructure remains the core equity narrative. Strong guidance and demand indicators from server and data-center suppliers have spilled across the hardware ecosystem globally, lifting related names in the US and Asia. Select consumer and retail names lagged after cautious updates on category demand and product mix. Capital commitments to next‑generation compute remain notable, with multi‑year investment plans in advanced technologies drawing investor interest. Key Themes We’re Watching Inflation trajectory: US core inflation progress, European price dynamics, and how energy’s recent pullback feeds into summer prints. Policy path: The balance between growth resilience and inflation persistence for the Fed, and whether European central banks tilt more hawkish on recent data. Earnings breadth: Signs that performance is expanding beyond megacap tech, and the durability of AI‑related capital spending. Geopolitics: Any durable de‑escalation in the Middle East and implications for energy and havens. Positioning and flows: Systematic re‑risking, buyback activity into blackout exits, and whether cash on the sidelines leans into dips or strength. Market Snapshot (as of early US morning, subject to change) US equity futures: Flat to slightly higher near records Europe: Broad indices firmer, approaching highs Asia: Strong gains led by Korea and Japan on chip strength US 10-year Treasury: Steady around the mid‑4% range Brent crude: Around the low-$90s, lower on the month USD: Modestly firmer in May versus majors Risk Considerations Concentrated leadership raises vulnerability to factor reversals. Reacceleration in inflation—particularly in services—or renewed energy spikes could pressure duration and risk assets. Geopolitical headlines remain a swing factor for oil, the dollar, and broader risk sentiment. Looking Ahead Upcoming inflation and labor data in the US and Europe Early June central-bank commentary Ongoing AI, semiconductor, and cloud spending updates from corporates Energy policy and producer guidance into the summer driving season Build a Resilient Investment Strategy Discover tailored wealth management solutions and structured products designed to optimize returns while aligning with your risk profile. Discover Wealth Management Disclaimer: Trading foreign exchange and/or contracts for difference on margin carries a high level of risk, and may not be suitable for all investors as you could sustain losses in excess of deposits. The products are intended for retail, professional and eligible counterparty clients. Before deciding to trade any products offered by PhillipCapital (DIFC) Private Limited you should carefully consider your objectives, financial situation, needs and level of experience. You should be aware of all the risks associated with trading on margin. The content of the Website must not be construed as personal advice. For retail, professional and eligible counterparty clients. Before deciding to trade any products offered by PhillipCapital (DIFC) Private Limited you should carefully consider your objectives, financial situation, needs and level of experience. You should be aware of all the risks associated with trading on margin. Rolling Spot Contracts and CFDs are complex instruments and come with a high risk

Daily Market Updates – May 29 قراءة المزيد »