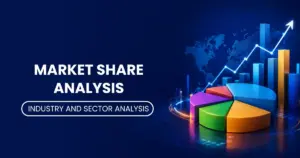
Market Share Analysis How Investors Measure Company Dominance in an...
Read More


Competitive Positioning
Competitive Positioning Table of Contents Introduction What Is Competitive Positioning...
Read More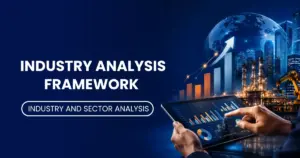
Industry Analysis Framework
Sector Classification Systems Table of Contents Introduction What Is an...
Read More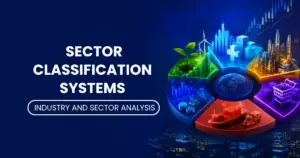
Sector Classification Systems
Sector Classification Systems Introduction Every listed company belongs somewhere. Whether...
Read More
Options Exercise & Assignment
Options Exercise & Assignment Table of Contents Introduction What Does...
Read More
American vs European Options
American vs European Options Table of Contents Introduction What Is...
Read More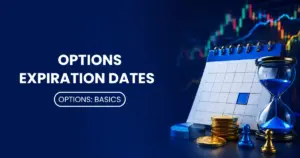
Options Expiration Dates
Options Expiration Dates Table of Contents Introduction What Is an...
Read More
Options Strike Price
Options Strike Price Table of Contents Introduction What Is a...
Read More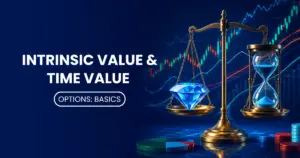
Intrinsic Value and Time Value
Intrinsic Value and Time Value Introduction When you buy or...
Read More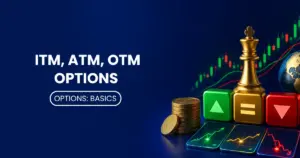
In-the-Money, At-the-Money, Out-of-the-Money Options
In-the-Money, At-the-Money, Out-of-the-Money Options Introduction If you have started exploring...
Read More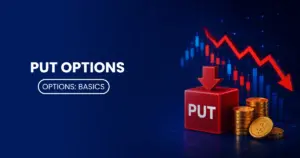
Put Options Explained
Put Options Explained Table of Contents Introduction What Is a...
Read More
Call Options Explained
Call Options Explained Table of Contents Introduction What Exactly Is...
Read More
Options Fundamentals
Options Fundamentals Table of Contents Introduction What Is an Option...
Read More
Deferred Coupon Bonds
Perpetual Bonds Table of Contents Introduction What Are Deferred Coupon...
Read More
Perpetual Bonds
Perpetual Bonds Table of Contents Introduction What Are Perpetual Bonds?...
Read More
Inflation-Linked Bonds
Inflation-Linked Bonds Introduction Inflation is the silent tax that erodes...
Read More
Convertible Bonds Basics
Convertible Bonds Explained: Structure, Benefits, and Risks for Investors Table...
Read More
Callable and Putable Bonds
Callable and Putable Bonds Table of Contents Introduction What Is...
Read More
Floating Rate Bonds
Floating Rate Bonds Introduction Interest rates move. That is one...
Read More
Zero-Coupon Bonds
Zero-Coupon Bonds Introduction Most bonds pay you regular interest —...
Read More
Municipal Bonds and Tax Implications
Municipal Bonds & Tax Implications Introduction When investors look for...
Read More
Corporate Bonds and Corporate Credit
Government Bonds & Treasury Securities Guide Table of Contents Introduction...
Read More
Government Bonds & Treasury Securities
Government Bonds & Treasury Securities Guide Introduction When markets get...
Read More
Bollinger Bands Strategy
Bollinger Bands Strategy Introduction Every trader, at some point, asks...
Read More
Moving Average Crossover
Moving Average Crossover Introduction Every trader, whether new or experienced,...
Read More
Support-Resistance Bounce
Support/Resistance Bounce Table of Contents Introduction What Is Support and...
Read More
Breakout Trading
Breakout Trading Introduction Every experienced trader knows that markets don’t...
Read More
Mean Reversion
Mean Reversion Table of Contents Introduction What Is Mean Reversion...
Read More
Momentum Trading
Momentum Trading Table of Contents What Is Momentum Trading? How...
Read More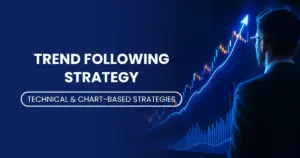
Trend Following Strategy
Trend Following Strategy Introduction Most traders spend years trying to...
Read More