
Supply Chain Analysis for Equity Investors Introduction Every product a...
Read More


Market Share Analysis
Market Share Analysis How Investors Measure Company Dominance in an...
Read More
Competitive Positioning
Competitive Positioning Table of Contents Introduction What Is Competitive Positioning...
Read More
Industry Analysis Framework
Sector Classification Systems Table of Contents Introduction What Is an...
Read More
Sector Classification Systems
Sector Classification Systems Introduction Every listed company belongs somewhere. Whether...
Read More
Working Capital Analysis
Working Capital Analysis Introduction When you look at a company’s...
Read More
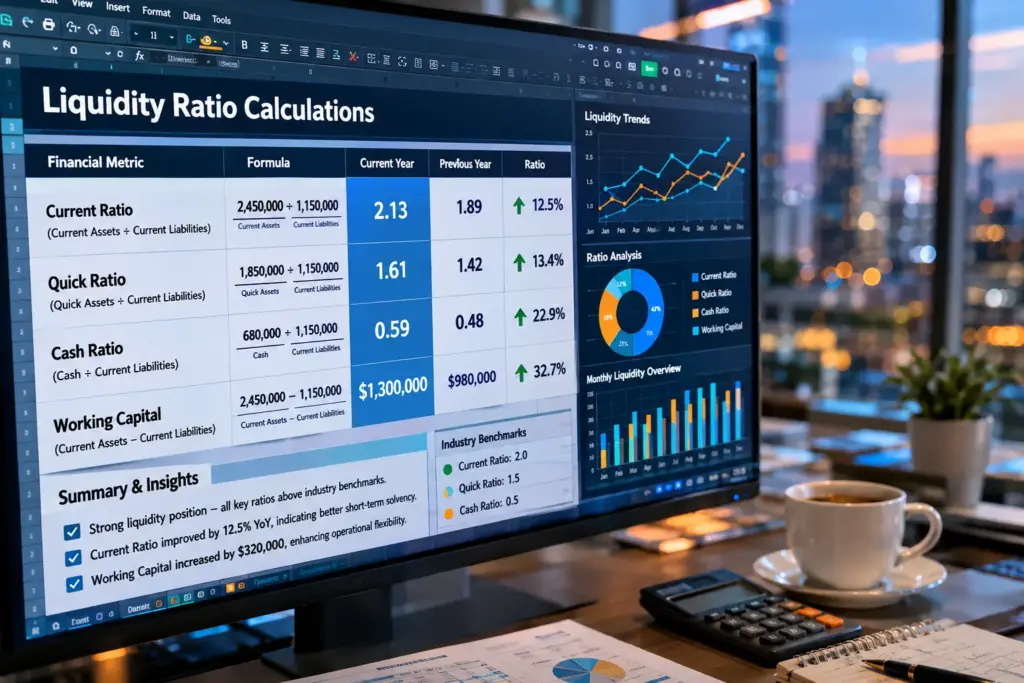
Current Ratio vs Quick Ratio
Current Ratio and Quick Ratio Table of Contents Introduction What...
Read More
debt-to-equity ratio
Debt-to-Equity Ratio Table of Contents Introduction What is the Debt-to-Equity...
Read More
Return on Equity (ROE)
Return on Equity (ROE) Table of Contents Introduction What Is...
Read More
Return on Assets
Return on Assets (ROA) Introduction When you look at a...
Read More
Profit Margins & Profitability
Profit Margins and Profitability Introduction When you look at a...
Read More
Revenue Growth Analysis
Revenue Growth Analysis Table of Contents Introduction What Is Revenue...
Read More
Earnings Per Share
Earnings Per Share (EPS) A Complete Guide for Equity Investors...
Read More
Statement of Changes in Equity
Statement of Changes in Equity Table of Contents Introduction What...
Read More
Cash Flow Statement Analysis
Cash Flow Statement Analysis Table of Contents Introduction What Is...
Read More
Understanding Balance Sheets
Understanding Balance Sheets Understanding Balance Sheets: A Complete Guide for...
Read More
Reading Income Statements
Reading Income Statements Table of Contents What Is an Income...
Read More
Fundamental Analysis for Stocks
Fundamental Analysis for Stocks Mastering Fundamental Analysis for Stocks: A...
Read More
Discounted Cash Flow (DCF) Model
Discounted Cash Flow (DCF) Model Understanding the Discounted Cash Flow...
Read More
Intrinsic Value Calculation
Intrinsic Value Calculation Guide to Stock Valuations Intrinsic Value Calculation:...
Read More
Free Cash Flow Analysis
Cash Flow Analysis In the sophisticated world of global capital...
Read More

understanding dividend yield investment guide
Dividend Yield The Strategic Guide to Dividend Yield: Maximizing Passive...
Read More
Enterprise Value And Ev/Ebitda
Enterprise Value And EV/EBITDA Enterprise Value and EV/EBITDA: A Comprehensive...
Read More
Price-to-Sales Ratio (P/S)
Price-to-Sales Ratio (P/S) Understanding the Price-to-Sales Ratio (P/S) in Modern...
Read More
Price-to-Book Ratio
Price-to-Book Ratio (P/B) The Essential Guide for Identifying Undervalued Stocks...
Read More
Price-to-Earnings Ratio (P/E)
Price-to-Earnings Ratio (P/E) Table of Contents What is the Price-to-Earnings...
Read More
Stock Valuation Methods
Stock Valuation Methods A Comprehensive Guide to Estimating Fair Value...
Read More
Stock Market Hours and Session Trading
Stock Market Hours and Session Trading A Global Guide for...
Read More
Initial Public Offering Process guide
IPO (Initial Public Offering) Process From Private to Public In...
Read More