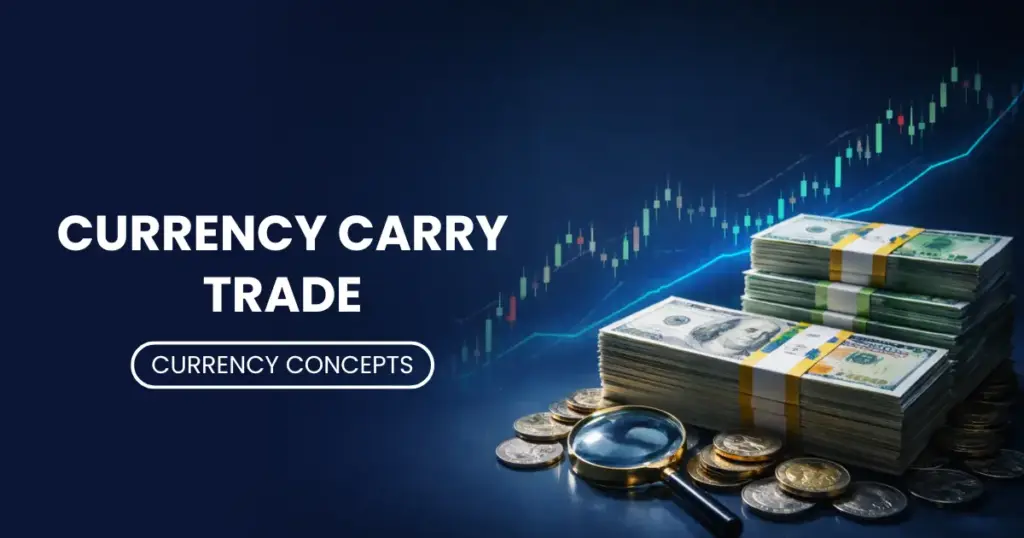
Educational Blogs

Risk and Return Profile

Understanding the Risk and Return Profile A Guide for Strategic Investing Table of Contents What Exactly Is a Risk and Return Profile? How Do Different Asset Classes Compare in Terms of Risk? Why Is Standard Deviation Critical for Measuring Volatility? How Does Diversification Alter an Investor’s Risk Profile? What Role Do Risk-Adjusted Ratios Play in Portfolio Selection? How Can Structured Products Engineer a Custom Risk-Return Outcome? Conclusion: Building a Resilient Portfolio Investing is rarely a linear path to profit; it is a calculated negotiation between the desire for growth and the tolerance for uncertainty. For investors in the Dubai International Financial Centre (DIFC) and the broader UAE, distinguishing between “risk” and “return” is not enough. One must understand the Risk and Return Profile—the unique behavioral signature of an investment that dictates how it is likely to perform under various market conditions. Whether you are an institutional client managing family office funds or an individual exploring global equities, defining this profile is the first step toward aligning your capital with your financial goals. What Exactly Is a Risk and Return Profile? A Risk and Return Profile is a comprehensive evaluation of an investment’s potential for financial loss against its potential for gain. It is not merely a label of “high” or “low” risk; it is a spectrum that considers the probability of negative outcomes, the magnitude of potential volatility, and the time horizon required to achieve expected returns. In professional wealth management, this profile serves as a blueprint. It helps investors determine if the “price” of an investment—in terms of sleepless nights or potential capital erosion—is worth the expected reward. For instance, a government bond typically has a conservative profile: low volatility and modest returns. In contrast, emerging market derivatives may offer a high-octane profile with significant upside but equally substantial downside exposure. How Do Different Asset Classes Compare in Terms of Risk? Every asset class carries a distinct DNA regarding how it reacts to economic shifts. Understanding this hierarchy is essential for constructing a balanced portfolio. Fixed Income (Bonds): generally sits at the lower end of the risk spectrum. Sovereign debt from stable economies is often used for capital preservation, though corporate bonds can introduce credit risk in exchange for higher yields. Equities (Stocks): occupy the middle-to-high ground. Owning shares in blue-chip US companies or growth-focused sectors involves accepting market fluctuations. The return potential is theoretically unlimited, but the investor absorbs the full volatility of the market. Derivatives (Futures & Options): are often at the higher end due to leverage. Instruments like Global Futures & Options allow traders to hedge or speculate, but the use of margin can amplify both gains and losses, significantly altering the risk profile. Forex (FX): The currency market is highly liquid but volatile. Trading Spot FX & CFDs involves navigating geopolitical events and central bank policies, creating a profile suited for active traders rather than passive “buy-and-hold” investors. Ready to Diversify Your Portfolio? Explore our range of global asset classes View Trading Products Why Is Standard Deviation Critical for Measuring Volatility? When analysts discuss “risk,” they are often referring to volatility—the degree to which an asset’s price swings around its average. Standard deviation is the statistical tool used to quantify this swing. If an investment has a high standard deviation, its price moves erratically. This erratic behavior defines a “high-risk” profile because the probability of needing to exit the investment during a downturn is higher. For investors managing Institutional Services or family offices, keeping standard deviation within acceptable limits is often more important than chasing the highest possible raw return. It ensures that the portfolio’s value remains relatively stable, facilitating liquidity needs and long-term planning. How Does Diversification Alter an Investor’s Risk Profile? Diversification is the only “free lunch” in finance because it can lower a portfolio’s overall risk profile without necessarily sacrificing expected returns. This works through correlation—or rather, the lack of it. By combining assets that do not move in perfect lockstep, such as US Stocks, ETFs & ADRs with commodities like Gold or Silver, investors can smooth out the ride. When equities dip due to economic cooling, commodities might rise as a hedge against inflation. This interplay reduces the aggregate standard deviation of the portfolio, creating a more efficient risk and return profile than holding any single asset in isolation. What Role Do Risk-Adjusted Ratios Play in Portfolio Selection? Raw returns can be deceptive. A 20% return sounds excellent, but if it required risking a 50% drawdown, the trade-off may not be favorable. This is where risk-adjusted metrics like the Sharpe Ratio come into play. The Sharpe Ratio measures the excess return generated for every unit of risk taken. A higher ratio indicates a more efficient investment. For sophisticated investors, calculating these ratios is vital when comparing Wealth Management strategies. It answers the critical question: “Am I being adequately compensated for the anxiety and uncertainty I am enduring?” If two funds offer the same return, but one has half the volatility, the latter has a superior risk and return profile. How Can Structured Products Engineer a Custom Risk-Return Outcome? One of the most powerful ways to modify a risk profile is through financial engineering. Structured Notes allow investors to reshape the standard payoff of an asset to fit specific views. For example, an investor might desire exposure to the S&P 500 but fears a market correction. A standard equity investment offers no safety net. However, a Capital Protected Note can change this profile entirely, offering participation in the upside while guaranteeing the principal amount at maturity (subject to issuer credit risk). Alternatively, Yield Enhancement notes can generate income in flat markets where traditional equities might stagnate. These tools essentially “bend” the risk-return line to suit the investor’s unique tolerance Customize Your Market Exposure Discover how Structured Notes can protect your capital. Learn About Structured Notes Conclusion: Building a Resilient Portfolio The search for the perfect investment is a myth; the search for the optimal Risk and Return Profile is the reality

Risk and Return Profile Read More »

Price-to-Earnings Ratio (P/E)

Price-to-Earnings Ratio (P/E) Table of Contents What is the Price-to-Earnings (P/E) Ratio and how is it calculated? What is the difference between Trailing P/E and Forward P/E? How do you interpret High vs. Low P/E Ratios? Why does the P/E Ratio vary across different sectors? What are the limitations of relying solely on the P/E Ratio? How can P/E be used in a comprehensive investment strategy? Conclusion Understanding how to value a company is the cornerstone of successful investing. Whether you are building a portfolio of global securities or analysing potential growth stocks, the Price-to-Earnings Ratio (P/E) remains one of the most widely used metrics in financial markets. It offers a quick snapshot of how the market values a company relative to its actual earnings, helping investors determine if a stock is overvalued, undervalued, or fairly priced. What is the Price-to-Earnings (P/E) Ratio and how is it calculated? Understanding how to value a company is the cornerstone of successful investing. Whether you are building a portfolio of global securities or analysing potential growth stocks, the Price-to-Earnings Ratio (P/E) remains one of the most widely used metrics in financial markets. It offers a quick snapshot of how the market values a company relative to its actual earnings, helping investors determine if a stock is overvalued, undervalued, or fairly priced. The formula is straightforward: P/E Ratio = Market Value per Share / Earnings per Share (EPS) For example, if a company trading on the US stock market has a share price of $100 and an EPS of $5, its P/E ratio would be 20 ($100 / $5). This means investors are currently paying 20 times the company’s annual earnings to own the stock. For investors using global equities brokerage services to access markets like the NYSE or LSE, understanding this calculation is the first step in filtering potential investment opportunities. It standardises the cost of earnings across different companies, allowing for easier comparison. What is the difference between Trailing P/E and Forward P/E? While the basic calculation remains the same, the data used for “earnings” can change the ratio significantly. There are two primary variations: Trailing P/E: This uses the earnings per share over the last 12 months (TTM). It is grounded in factual, historical data reported in company financial statements. However, because it looks backward, it may not reflect the company’s future potential or recent changes in the economic environment. Forward P/E: This uses projected earnings for the next 12 months, based on analyst estimates. Forward P/E is often more useful for investors focused on future growth, as markets are generally forward-looking mechanisms. However, it carries the risk of inaccuracy if the company fails to meet analyst expectations. Sophisticated investors often compare both. A Forward P/E that is significantly lower than the Trailing P/E suggests that analysts expect earnings to grow, potentially making the stock an attractive buy. Conversely, if the Forward P/E is higher, earnings may be expected to shrink. Access the World’s Top Equity Markets Trade US, European, and Asian stocks with the security of a trusted, DIFC-regulated broker. Open an account Contact us How do you interpret High vs. Low P/E Ratios? Interpreting the P/E ratio is not as simple as “low is good, high is bad.” The context matters immensely, particularly regarding your investment style—whether you prefer buy and hold strategies or active trading. High P/E Ratio (Growth Stocks): A high P/E often indicates that the market expects high future growth. Investors are willing to pay a premium today because they anticipate earnings will surge in the future. Technology companies and innovative startups often trade at high P/E multiples. However, a very high P/E can also signal that a stock is overvalued and due for a correction. Low P/E Ratio (Value Stocks): A low P/E can indicate that a stock is undervalued, potentially offering a bargain opportunity. These are often mature companies with stable cash flows. However, caution is required; a low P/E can sometimes be a “value trap,” where the price is low because the company’s fundamentals are deteriorating. For investors exploring Exchange Traded Funds (ETFs), looking at the weighted average P/E of an entire fund can also help assess whether a specific market index is overheated or reasonably priced. Why does the P/E Ratio vary across different sectors? Comparing the P/E ratio of a tech company to that of a utility provider is like comparing apples to oranges. Different industries have different average P/E ratios due to their growth prospects and risk profiles. Technology & Biotech: Typically have higher P/E ratios (e.g., 25x or higher) because investors price in rapid expansion and innovation. Utilities & Financials: Often have lower P/E ratios (e.g., 10x to 15x) because they are mature industries with regulated, steady, but slower growth. This is why a sector rotation strategy is critical. When the economy is booming, capital often flows into high P/E sectors. In recessionary periods, money tends to rotate into low P/E, defensive sectors. Always compare a company’s P/E to its industry peers rather than the broader market to get an accurate valuation. What are the limitations of relying solely on the P/E Ratio? While powerful, the P/E ratio should never be used in isolation. It has distinct limitations that savvy investors must acknowledge: Debt is Ignored: The P/E ratio looks at equity value but ignores a company’s debt load. Two companies might have the same P/E, but if one is heavily leveraged, it carries significantly higher risk. Earnings Manipulation: Companies can sometimes adjust their accounting practices to boost reported earnings temporarily, artificially lowering their P/E to look more attractive. Cyclical Industries: For companies in cyclical sectors (like commodities or heavy industry), P/E ratios can be misleading. At the peak of a cycle, earnings are high, making the P/E look artificially low just before the cycle turns. For investors seeking to mitigate these specific equity risks, diversifying into structured products can offer tailored exposure with defined risk parameters, serving as a hedge against the volatility inherent in pure equity

Price-to-Earnings Ratio (P/E) Read More »

Base Currency vs Quote Currency

Base Currency vs Quote Currency Table of Contents What is the Fundamental Structure of a Currency Pair? How Do Base and Quote Currencies Determine Exchange Rates? Why Is the Order of Currencies Fixed in Standard Pairs? How Does the Quote Currency Impact Profit and Loss Calculations? What Role Do Spreads Play in Base vs Quote Pricing? Conclusion What is the Fundamental Structure of a Currency Pair? In the global foreign exchange markets, currencies are never traded in isolation; they are always traded in pairs. This structure allows investors to measure the value of one currency relative to another. The Base Currency is the first currency listed in the pair. It serves as the reference point for the transaction and always has a notional value of 1. Whether you are buying or selling a currency pair, you are essentially performing that action on the base currency. The Quote Currency (often called the counter currency) is the second currency listed. It represents the amount required to purchase one unit of the base currency. For example, in the EUR/USD pair: EUR is the Base Currency. USD is the Quote Currency. If you decide to execute a trade, the direction of your position depends on your view of the base currency. A “long” (buy) position indicates you expect the base currency to appreciate against the quote currency. Conversely, a “short” (sell) position implies you anticipate the base currency will depreciate relative to the counter currency. This dual mechanism is the foundation of Spot FX trading, allowing investors to capitalize on both rising and falling markets. How Do Base and Quote Currencies Determine Exchange Rates? The exchange rate you see on your trading platform is strictly a reflection of the quote currency’s value per single unit of the base currency. Let’s look at a practical example using a major pair. If the GBP/USD is trading at 1.2500: Base (GBP): 1 British Pound. Quote (USD): 1.25 US Dollars. This price tells you that to acquire 1 GBP, you must sell 1.25 USD. If the exchange rate rises to 1.2600, it means the base currency (GBP) has strengthened—it now “costs” more US dollars to buy the same pound. If the rate falls to 1.2400, the base currency has weakened. For investors trading on global markets via platforms like MetaTrader 5, understanding this relationship is critical for reading charts. A chart moving upward always signifies strength in the base currency, while a downward trend signifies strength in the quote currency. This inverse relationship is vital when analyzing economic data; for instance, positive US economic news typically strengthens the USD. If the USD is the quote currency (e.g., EUR/USD), the chart will likely move down. Which Pairs Should You Trade First? Discover why the EUR/USD and other major pairs offer the best liquidity for beginners Read the Guide to Major Currency Pairs Why Is the Order of Currencies Fixed in Standard Pairs? In the interbank market, the order of currencies is established by global convention and cannot be changed by the trader. This standardization ensures that liquidity providers, banks, and brokers—including those in the DIFC financial hub—are all speaking the same “language.” The hierarchy generally places the currency with the higher historical value or dominance as the base currency. The typical priority order for major currencies is: Euro (EUR) British Pound (GBP) Australian Dollar (AUD) New Zealand Dollar (NZD) United States Dollar (USD) Canadian Dollar (CAD) Swiss Franc (CHF) Japanese Yen (JPY) This is why you will see EUR/USD (Euro is priority 1) but USD/JPY (USD is priority 5, higher than JPY). There are rare exceptions in some exotic crosses, but adhering to this hierarchy is standard practice. Understanding this hierarchy helps investors quickly identify which asset they are technically buying or selling, which is particularly important when diversifying into major and exotic currency pairs. How Does the Quote Currency Impact Profit and Loss Calculations? A crucial but often overlooked detail is that your Profit and Loss (P&L) is always valued in the Quote Currency. If you are trading USD/JPY, the quote currency is the Japanese Yen. Therefore, your pip value and initial profit calculation will be in Yen. To reflect this in your trading account balance (assuming your account is denominated in USD), the platform automatically converts that Yen profit back into US Dollars at the current exchange rate. Example: You buy EUR/USD (Quote currency is USD). If you gain 50 pips, and each pip is worth $10, your profit is **$500**. Because the quote currency matches your account currency (USD), no conversion is needed. However, if you trade USD/CHF (Quote currency is Swiss Franc): Your profit is earned in CHF. The broker converts this CHF amount into USD to display your final equity. For professional investors managing a diverse portfolio, keeping track of the quote currency is essential for accurate risk management and margin calculations. Sophisticated traders often utilize structured products or hedging strategies to mitigate the risk of currency fluctuations affecting their realized P&L. What Role Do Spreads Play in Base vs Quote Pricing? When you open a trade, you will see two prices: the Bid (sell price) and the Ask (buy price). The difference between them is the Spread. Ask Price: The price you pay to buy the Base currency (denominated in Quote currency). Bid Price: The price you receive to sell the Base currency (denominated in Quote currency). Liquidity plays a massive role here. Pairs involving major global currencies like the USD or EUR typically have high liquidity, resulting in tighter spreads. Conversely, pairs with less liquid quote currencies (such as the Turkish Lira or South African Rand) often have wider spreads. Investors should be aware that the spread is effectively a transaction cost derived from the quote currency. During periods of high volatility—such as central bank announcements or geopolitical shifts—spreads can widen significantly. Utilizing a robust trading ecosystem, such as the one provided by Phillip Capital DIFC, ensures you have access to competitive spreads and reliable execution even during turbulent market conditions.

Base Currency vs Quote Currency Read More »

Notional Value vs Market Value

Notional Value vs Market Value Table of Contents What Is Notional Value in Financial Markets? How Does Market Value Differ from Notional Value? Why Is the Distinction Critical for Leveraged Trading? How Are Notional and Market Values Calculated in Derivatives?  * Calculating Value in Futures Contracts  * Understanding Options Valuations When Should Investors Focus on Notional Over Market Value? Conclusion What Is Notional Value in Financial Markets? In the realm of institutional and professional trading, “price” is rarely a singular concept. Notional value (often referred to as notional amount or nominal value) represents the total underlying value of a financial asset that a contract controls. It is a theoretical value used primarily to calculate payments, interest rates, and leverage ratios, rather than the immediate cash amount required to enter a trade. For investors utilizing global futures and options, notional value is the metric that defines the true scale of market exposure. For instance, when you trade a commodities futures contract, the initial margin you deposit might be small, but the notional value reflects the total worth of the commodities (e.g., 1,000 barrels of oil) controlled by that contract. Understanding this figure is essential for assessing the true depth of a portfolio’s exposure to market volatility. How Does Market Value Differ from Notional Value? While notional value represents the total assets controlled, market value is the actual current price at which a security, derivative, or portfolio can be bought or sold in the open market. It is the figure most investors see on their daily statements—the “mark-to-market” price that fluctuates second-by-second based on supply, demand, and liquidity. For a standard equity investor buying global stocks, the notional value and market value are typically identical; if you buy $10,000 worth of Apple stock, both values are $10,000. However, the divergence appears in derivatives. In a leveraged position, the market value usually refers to the cost of the contract itself (the premium or the margin equity), which is often a fraction of the notional value. This distinction is vital for capital efficiency, as it dictates how much capital is actually tied up versus how much risk is being taken. Why Is the Distinction Critical for Leveraged Trading? The gap between notional and market value is the essence of leverage. Professional traders use this gap to amplify returns, but it effectively amplifies risk as well. If an investor focuses solely on the market value (the cash utilized), they may underestimate the magnitude of a potential loss. Risk management protocols at top-tier brokerage firms often stress-test portfolios based on notional value. For example, a movement of 1% in the underlying asset price affects the investor based on the notional value, not the cash invested. Investors trading CFDs and Spot FX must remain acutely aware that while their deposited margin (market value of equity) might be low, their notional exposure to currency fluctuations remains at the full contract size. Optimize Your Capital Efficiency Access global markets with competitive leverage and institutional-grade support. Start Trading Today How Are Notional and Market Values Calculated in Derivatives? The calculation methods vary depending on the instrument, but the principle remains: one measures exposure, the other measures cost. Calculating Value in Futures Contracts In futures trading, the notional value is calculated by multiplying the contract size by the current price of the underlying asset. Formula: Notional Value = Contract Size × Current Underlying Price Example: If the S&P 500 futures contract has a multiplier of $50 and the index is at 4,000, the notional value is $200,000. The market value of the position to the trader, however, is initially zero (at par) or represented by the margin requirement, adjusting daily as the contract gains or loses value. Understanding Options Valuations Options introduce a layer of complexity. Notional Value: Typically the Strike Price × Number of Shares × Number of Contracts. This represents the value of the stock if the option were exercised. Market Value: This is the premium paid to buy the option. For investors using hedging strategies with options, distinguishing these values is paramount. A put option might cost only $500 (market value), but it could be hedging a portfolio with a notional value of $50,000. When Should Investors Focus on Notional Over Market Value? Sophisticated investors and asset managers prioritize notional value in specific scenarios: Asset Allocation: When determining if a portfolio is overweight in a specific sector (e.g., Technology or Energy), one should look at the notional exposure of derivatives, not just the premium paid. Hedge Ratios: To effectively hedge a physical stock portfolio using DGCX Futures or other derivatives, the notional value of the hedge must match the market value of the physical assets. Regulatory Compliance: Institutional clients and family offices operating under strict mandates often have caps on gross notional exposure to limit systemic risk. Conversely, market value is the primary focus for liquidity management, ensuring there is enough cash on hand to meet margin calls or fund new opportunities in structured notes and yield-enhancing products. Professional Portfolio Management Get expert guidance on managing exposure and risk Contact Us Conclusion Mastering the dynamics between notional value and market value is a hallmark of an advanced investor. While market value dictates the immediate financial health of an account, notional value reveals the true footprint of your investment strategy in the global marketplace. Whether you are trading deliverable equities or navigating complex derivatives, keeping a vigilant eye on both metrics ensures a balanced approach to risk and reward. At PhillipCapital DIFC, we provide the robust platforms and analytical tools necessary to monitor these values in real-time, empowering you to make data-driven decisions across asset classes. Frequently Asked Questions (FAQs) 1. Why is the notional value usually so much higher than the market value? This significant difference exists primarily due to leverage. In derivatives trading (like futures or CFDs), you are only required to deposit a fraction of the total trade size (the margin) to open a position. While the market value reflects this smaller cash outlay or

Notional Value vs Market Value Read More »

Short-Term, Intermediate, and Long-Term Bonds

Bond Maturities Short-Term, Intermediate, and Long-Term Bonds Table of Contents What Are Bond Maturities and Why Do They Matter? What Defines a Short-Term Bond? How Do Intermediate-Term Bonds Balance Risk and Reward? When Should Investors Consider Long-Term Bonds? How Does the Yield Curve Impact Bond Maturity Choices? Which Bond Duration Fits Your Investment Portfolio? Conclusion What Are Bond Maturities and Why Do They Matter? In the world of fixed-income investing, maturity is more than just a date on a calendar; it is the primary driver of a bond’s risk profile and potential return. When you purchase a bond, you are essentially lending capital to an issuer—be it a government or a corporation—for a specific period. The “maturity date” is the deadline by which that issuer must repay your principal investment. Understanding maturity is crucial because it dictates how sensitive your investment is to interest rate fluctuations and inflation. A well-structured fixed income portfolio often utilizes a mix of maturities to smooth out volatility. Whether you are preserving wealth through sovereign debt or seeking higher yields in the corporate sector, the timeline of your bond investment defines your liquidity and expected cash flow. What Defines a Short-Term Bond? Short-term bonds are generally defined as debt securities with maturities ranging from one to three years. These instruments are often favored by conservative investors or those managing near-term liquidity needs. Because the capital is tied up for a relatively brief period, the risk of default and the impact of interest rate changes are significantly lower compared to longer-dated securities. Key Characteristics: Lower Volatility: Short-term bonds are less sensitive to interest rate hikes. If rates rise, the price of a short-term bond drops less than that of a long-term bond. High Liquidity: These assets can often be converted to cash quickly with minimal price impact, making them a staple in wealth management strategies for holding operating cash. Modest Yields: In exchange for safety and liquidity, investors typically accept lower yields compared to longer-term options. Who is this for? Short-term bonds are ideal for investors who need to access their funds in the near future or those who wish to “park” capital safely while waiting for market volatility to settle. Secure Your Liquidity Explore Short-Term Opportunities Discover stable, high-quality fixed-income assets tailored for capital preservation. Explore Global Bonds How Do Intermediate-Term Bonds Balance Risk and Reward? Intermediate-term bonds typically have maturities between three and ten years. They serve as the “middle ground” in a portfolio, offering a compelling compromise between the low yields of short-term debt and the high volatility of long-term debt. For many sophisticated investors, this category represents the core of a diversified income strategy. Intermediate bonds usually capture a significant portion of the yield available in the market without exposing the investor to extreme duration risk. If interest rates rise, these bonds will experience moderate price fluctuations, but the higher coupon payments can help cushion the blow over time. Investors utilizing our global markets trading platforms often allocate to intermediate treasuries or investment-grade corporate bonds to anchor their portfolios. This “laddering” approach allows them to lock in respectable rates while maintaining a degree of flexibility. When Should Investors Consider Long-Term Bonds? Long-term bonds are securities that mature in 10 to 30 years (or more). These are the heavyweights of the fixed-income world, offering the highest potential yields to compensate investors for locking away their capital for decades. The Duration Factor: The defining feature of long-term bonds is their high duration. Duration measures a bond’s sensitivity to interest rate changes. A 30-year bond will see its price swing dramatically if interest rates move even a small amount. This makes long-term bonds a tool for investors with a strong conviction about the future direction of the economy—specifically, those who believe inflation and interest rates will decline. The Role in a Portfolio: While volatile, long-term bonds often have a low correlation with equities. During periods of economic deflation or recession, when stock markets may struggle, high-quality long-term government bonds often rally, providing a critical hedge. Accessing these specific durations requires a robust partner capable of navigating complex global bond markets. Optimize Your Yield Plan for Long-Term Growth Access premium long-term sovereign and corporate bonds to boost your portfolio yield. Contact Now How Does the Yield Curve Impact Bond Maturity Choices? The yield curve is a graphical representation of the interest rates on debt for a range of maturities. In a healthy economy, the curve slopes upward, meaning long-term bonds yield more than short-term bonds. This “term premium” rewards investors for the risk of holding debt over time. However, the shape of the curve changes. Steep Curve: Suggests rapid economic growth; long-term bonds offer much higher yields. Flat Curve: Suggests uncertainty; yields are similar across maturities. Inverted Curve: Occurs when short-term rates are higher than long-term rates, historically a signal of an impending recession. Monitoring the yield curve is essential for tactical asset allocation. For instance, if the curve is inverted, an investor might prefer structured investment solutions or short-term notes rather than locking in lower rates for the long haul. Which Bond Duration Fits Your Investment Portfolio? Selecting the right maturity is not a binary choice; it is a strategic decision based on your financial horizon and risk tolerance. For Capital Preservation: If your goal is to protect principal for a purchase in the next 12-24 months, focus on short-term government securities. For Income Generation: If you need a steady income stream to fund living expenses or other liabilities, an intermediate-term ladder provides a reliable blend of yield and stability. For Aggressive Total Return: If you are managing a long-horizon fund or family office capital and anticipate a drop in interest rates, long-term bonds offer significant capital appreciation potential. Investors should also consider the tax implications and currency exposure when trading international debt. Utilizing institutional brokerage services can provide the necessary access to diverse markets, ensuring that your duration strategy is executed efficiently across different jurisdictions. Conclusion The distinction between short-term, intermediate, and long-term

Short-Term, Intermediate, and Long-Term Bonds Read More »

Sector Rotation Strategy

Sector Rotation A Strategic Guide to Investing Through Economic Cycles Table of Contents What is Sector Rotation and why is it a critical strategy for professional investors? How does the Economic Business Cycle dictate market performance? The Early Cycle (Recovery) The Mid Cycle (Expansion) The Late Cycle (Moderation) The Recession Phase (Contraction) What are the most effective instruments for executing Sector Rotation? How can investors mitigate the specific risks associated with Sector Rotation? Conclusion What is Sector Rotation and why is it a critical strategy for professional investors? Sector rotation is an active investment strategy that involves moving capital from one industry sector to another in anticipation of the next stage of the economic cycle. Unlike a passive “buy and hold” strategy, sector rotation assumes that the economy moves in predictable patterns—and that specific sectors perform better during different phases of those patterns. For investors utilizing global market access, the primary objective is to capture “alpha”—excess returns above a benchmark—by overweighting sectors expected to outperform and underweighting those expected to lag. For instance, holding high-growth technology stocks during an economic boom and shifting toward defensive utilities during a slowdown. This strategy requires a “top-down” approach. Investors must first analyze macroeconomic indicators—such as interest rates, inflation data, and GDP growth—before selecting individual equities. By leveraging the research and analysis available through sophisticated trading platforms, investors can identify which sectors are gaining momentum and which are losing steam, allowing for more dynamic portfolio management. How does the Economic Business Cycle dictate market performance? The premise of sector rotation relies heavily on the four distinct stages of the business cycle. Understanding where the global economy sits within this cycle is paramount for successful execution. The Early Cycle (Recovery) The early cycle marks the turnaround from a recession. Economic activity picks up, credit conditions loosen, and consumer confidence begins to rebound. Historically, this is often the most robust phase for equity performance. During this phase, interest rates are typically low, encouraging borrowing and expansion. Investors often find that Consumer Discretionary and Financials outperform, as banks benefit from increased lending and consumers return to spending on non-essential goods. The Mid Cycle (Expansion) This is typically the longest phase of the business cycle. Growth is consistent, but the explosive momentum of the recovery phase stabilizes. The economy is healthy, but inflation may start creeping up, prompting central banks to consider tightening monetary policy. In this environment, market leadership often shifts toward Information Technology and Industrials. These sectors thrive on consistent corporate spending and global demand. Investors utilizing Contracts for Difference (CFDs) can effectively trade the volatility that often accompanies the transition from early to mid-cycle. The Late Cycle (Moderation) As the economy overheats, inflation pressures rise, and growth rates slow. Central banks usually raise interest rates to cool the economy, which tightens liquidity. This environment favors inflation-sensitive sectors. Energy and Materials often outperform here, as commodity prices tend to peak late in the cycle. Conversely, high-valuation growth stocks may suffer as the cost of capital increases. The Recession Phase (Contraction) Economic activity shrinks, corporate profits decline, and the market often enters a bearish trend. The goal here is capital preservation. Investors typically flock to “defensive” sectors—industries that provide essential services regardless of the economic climate. Consumer Staples, Health Care, and Utilities become the safe havens of choice. Because demand for food, medicine, and electricity remains constant, these sectors tend to offer dividends and stability when the broader market falls. Align Your Portfolio with Market Cycles Access global exchanges and trade diverse sectors with Phillip Capital’s advanced platforms. Contact Now What are the most effective instruments for executing Sector Rotation? Executing a sector rotation strategy requires instruments that offer liquidity, low transaction costs, and broad exposure. Exchange Traded Funds (ETFs): For most investors, ETFs are the primary vehicle for sector rotation. Rather than buying 20 different utility companies, an investor can purchase a single Utilities Select Sector ETF. This provides instant diversification within the specific sector. Individual Equities: For those seeking higher potential returns, selecting top-performing stocks within a favored sector is a viable approach. This requires deeper fundamental analysis but allows for greater precision. Futures and Options: Sophisticated investors often use Futures to hedge exposure or bet on the direction of a sector index without owning the underlying assets. This is particularly useful during the recession phase to hedge against downside risk. CFDs (Contracts for Difference): CFDs allow traders to speculate on the price movements of sector indices or specific stocks without owning the asset. This is crucial for sector rotation because it allows for short-selling. If an investor believes the Tech sector is overvalued, they can short a Tech CFD to profit from the decline. Investors trading through Phillip Capital DIFC gain access to these diverse asset classes, ensuring they have the right tools to execute a rotation strategy efficiently across US, Asian, and European markets. Trade Global ETFs and CFDs Get competitive spreads and institutional-grade execution on sector-specific instruments Explore How can investors mitigate the specific risks associated with Sector Rotation? While sector rotation offers the potential for significant returns, it is an active strategy that carries inherent risks, primarily centered around timing and transaction costs. Timing Risk: The market looks forward, while economic data looks backward. If an investor waits for official GDP data to confirm a recession, the market may have already priced it in. Successful rotation requires analyzing leading indicators. False Signals: Economic cycles do not always follow a smooth sine wave. A “soft landing” (where the economy slows but avoids recession) can catch defensive investors off guard as growth stocks rally unexpectedly. Transaction Costs: unlike a buy-and-hold strategy, frequent rotation incurs trading fees and spreads. It is vital to use a broker that offers competitive pricing structures to ensure that transaction costs do not erode the alpha generated by the strategy. Over-concentration: Shifting too heavily into a single sector violates the principles of diversification. Even if the macro analysis is correct, a regulatory change or natural disaster could impact

Sector Rotation Strategy Read More »

How Structured Products Work

How Structured Products Work A Complete Guide for Investors Table of Contents What Is a Structured Product and How Is It Created? What Are the Key Components of a Structured Note? How Do Structured Products Protect Capital or Enhance Yields? What Are the Most Common Types of Structured Products? What Are the Main Risks Investors Should Be Aware Of? Who Should Invest in Structured Products? Conclusion What Is a Structured Product and How Is It Created? A structured product is a pre-packaged investment strategy that typically combines two distinct financial instruments into a single unit. Unlike buying a standard stock or bond, where your returns are directly tied to the asset’s price movement, a structured product essentially “engineers” a specific risk-return payoff. These products are created by investment banks to meet specific investor needs that traditional markets cannot satisfy alone. For example, an investor might want the growth potential of the S&P 500 but with the safety of a government bond. To achieve this, the issuer combines a zero-coupon bond (for capital protection) with an option component (for market participation). By customizing these elements, issuers can create products that offer capital protection, yield enhancement, or access to hard-to-reach asset classes. For a foundational understanding of these instruments and how we approach them at Phillip Capital, you can review our introduction to structured products. What Are the Key Components of a Structured Note? To understand how these products work, it helps to deconstruct them into their two primary “building blocks.” The Note (Debt Component): This is the “safe” part of the structure. It is essentially a bond issued by a financial institution. Its primary job is to protect your principal. In a capital-protected product, the issuer invests a large portion of your capital (e.g., 80-90%) into a zero-coupon bond that will mature at the full face value of your investment after a set period. The Derivative (Investment Component): The remaining capital is used to purchase a derivative, such as a call or put option. This component is linked to an “underlying asset”—which could be a single stock, a basket of equities, an index like the Nasdaq, or even a currency pair. Understanding what derivatives are and their purpose is crucial, as the performance of this specific component determines the “extra” return or coupon you receive. By adjusting the ratio between the note and the derivative, issuers can tailor the product to be conservative (more bond, less option) or aggressive (less bond, more option). Designed for Your Financial Objectives Get access to global structured notes designed for your risk profile. Learn More How Do Structured Products Protect Capital or Enhance Yields? The “magic” of structured products lies in their ability to reshape risk. They typically fall into two main strategic goals: Capital Protection: In uncertain markets, investors prioritize safety. A capital-protected note guarantees the return of 100% (or a partial percentage) of your initial investment at maturity, provided the issuer remains solvent. Even if the stock market crashes, your principal is safe because it is secured by the bond component. If the market rises, you participate in the gains through the option component. This allows conservative investors to gain exposure to volatile assets like US Equities & ETFs while strictly managing their downside risk. Yield Enhancement: In low-interest-rate environments, traditional bonds may offer unattractive returns. Yield enhancement products, such as Reverse Convertibles, offer significantly higher coupon payments (e.g., 8-12% p.a.). The trade-off is that you take on more risk; if the underlying asset falls below a certain “barrier” level, your capital may be at risk What Are the Most Common Types of Structured Products? While the possibilities are endless, most structured products in the UAE market fall into a few popular categories: Principal Protected Notes (PPNs): Ideal for conservative investors who want exposure to markets like Gold or the S&P 500 without risking their initial capital. Autocallables: These are very popular for generating income. The product has set observation dates. If the underlying asset is above a certain level on that date, the product “automatically calls” (matures early), paying you your capital plus a predefined bonus coupon. Reverse Convertibles: These pay a high fixed coupon regardless of market movement, but your principal repayment depends on the asset not falling below a specific “knock-in” barrier. Participation Notes: These offer 1:1 exposure to an asset (like a foreign index) but without the need for complex foreign exchange accounts or international brokerage setups. You can even structure notes around commodities; checking our available DGCX products can give you an idea of how gold and other local commodities are traded. What Are the Main Risks Investors Should Be Aware Of? Despite their benefits, structured products are not risk-free. It is vital to look beyond the headline return: Credit Risk: This is the most critical risk. When you buy a structured note, you are essentially lending money to the issuing bank (e.g., Goldman Sachs, JP Morgan, or similar). If that bank goes bankrupt, you could lose your entire investment, even if the “underlying asset” performed well. Liquidity Risk: These products are designed to be held until maturity (e.g., 1 to 5 years). While a secondary market often exists, selling early might result in selling at a discount. Market Risk: In yield enhancement products, if the barrier is breached (e.g., the stock drops by 40%), you may lose capital. Complexity: The terms can be complicated. For those who prefer more liquid, transparent trading options without lock-in periods or complex barriers, exchange-traded futures and options might be a more suitable alternative. Navigate Risks with Confidence Expert guidance to help you choose the right issuer with confidence. Contact Now Who Should Invest in Structured Products? Structured products are generally best suited for Sophisticated or Professional Investors who have a clear view of the market and want to express it precisely. The “Range-Bound” Investor: If you think the market will stay flat, a standard stock purchase won’t make money. A structured note can pay a coupon even in a flat

How Structured Products Work Read More »

Stock Valuation Methods

Stock Valuation Methods A Comprehensive Guide to Estimating Fair Value Table of Contents Unlocking the True Worth of Your Investments What exactly is stock valuation, and why is it critical for investors? What is the difference between Absolute and Relative valuation methods? How does the Discounted Cash Flow (DCF) model work? What are the most reliable Relative Valuation ratios? Is there a specific method for valuing dividend-paying stocks? How do I choose the right valuation method for my trade? Can valuation methods be applied to other assets like Futures or Options? Unlocking the True Worth of Your Investments In the dynamic world of financial markets, the difference between price and value is the cornerstone of successful investing. Whether you are eyeing high-growth tech giants in the US markets or stable dividend-paying companies in the GCC region, understanding stock valuation methods is essential. It transforms you from a speculator into an informed investor. At PhillipCapital DIFC, we believe that empowering our clients with deep market knowledge is as important as providing a robust trading platform. Below, we answer the most critical questions regarding how to value stocks effectively. What exactly is stock valuation, and why is it critical for investors? Stock valuation is the process of determining the intrinsic value (or “fair value”) of a company’s share. It is the financial detective work that tells you what a stock is actually worth, regardless of its current price on the ticker. The market price of a stock is driven by supply and demand, news cycles, and investor sentiment. Often, this price deviates significantly from the company’s fundamental health. Undervalued: If the calculated intrinsic value is higher than the current market price, the stock may be a buying opportunity. Overvalued: If the market price is higher than the intrinsic value, it might be time to sell or avoid the asset. For investors trading Global Stocks or Deliverable Equities through PhillipCapital DIFC, mastering valuation helps in building a portfolio that can withstand market volatility. It anchors your decisions in data rather than emotion, ensuring you don’t overpay for hype. What is the difference between Absolute and Relative valuation methods? Valuation strategies generally fall into two primary categories: Absolute and Relative. Understanding the distinction is vital for applying the right tool to the right asset. Absolute Valuation: This approach attempts to find a company’s intrinsic value based solely on its own fundamentals—specifically its cash flows, dividends, and growth rates. It does not worry about how other companies are performing. The most common model here is the Discounted Cash Flow (DCF) analysis. It is purely data-driven and focuses on the “present value” of the money the company will generate in the future. Relative Valuation: This method compares a company’s value to its competitors or industry peers. It asks, “Is this bank cheap compared to other banks in the UAE?” Investors use ratios/multiples like the Price-to-Earnings (P/E) or Price-to-Book (P/B) ratio to gauge value. This is faster and often more useful for short-term trading or when comparing stocks within the same sector, such as GCC Stocks or US Tech ETFs. How does the Discounted Cash Flow (DCF) model work? The Discounted Cash Flow (DCF) model is arguably the gold standard for absolute valuation. It operates on the principle that the value of a company today is the sum of all the cash it will generate in the future, discounted back to today’s dollars. Forecasting Free Cash Flow (FCF): An analyst projects the company’s revenue, expenses, and capital expenditures for the next 5 to 10 years to determine how much cash will be left over for shareholders. The Discount Rate: Future money is worth less than current money due to inflation and opportunity cost. We apply a discount rate (often the Weighted Average Cost of Capital, or WACC) to these future cash flows. Terminal Value: Since companies theoretically last forever, a “terminal value” is calculated to account for all cash flows beyond the forecast period. While powerful, DCF is sensitive. A small change in your growth assumptions or discount rate can drastically change the final valuation. It is best used for stable, mature companies with predictable cash flows.  Ready to Apply These Strategies? Access over 1 million stocks across global exchanges with a regulated broker. Open an account Contact us What are the most reliable Relative Valuation ratios? Relative valuation relies on “multiples.” Here are the three most widely used ratios for comparing stocks: Price-to-Earnings (P/E) Ratio: Calculated by dividing the share price by the Earnings Per Share (EPS). It tells you how much you are paying for every $1 of earnings. A high P/E usually suggests high growth expectations (common in US Tech stocks), while a low P/E might indicate a value bargain or a struggling company. Price-to-Book (P/B) Ratio: This compares the market value to the company’s book value (assets minus liabilities). It is exceptionally useful for valuing financial institutions and banks, which are prominent in the GCC Markets. A P/B under 1.0 can imply the stock is trading for less than the value of its assets. Enterprise Value-to-EBITDA (EV/EBITDA): This looks at the entire value of the firm (including debt) relative to its earnings before interest, taxes, depreciation, and amortization. It is often used for companies with heavy debt loads or large infrastructure assets, allowing for a cleaner comparison than the P/E ratio Is there a specific method for valuing dividend-paying stocks? Yes, for investors focused on income—such as those holding blue-chip stocks in our Wealth Management portfolios—the Dividend Discount Model (DDM) is highly effective. The DDM (specifically the Gordon Growth Model) assumes that a stock is worth the sum of all its future dividend payments, discounted back to their present value. Formula: Value = Expected Dividend / (Required Rate of Return – Dividend Growth Rate). This method is ideal for stable utility companies, REITs (Real Estate Investment Trusts), or established banks that have a long history of consistent dividend payouts. However, it is ineffective for high-growth tech companies that reinvest their profits rather

Stock Valuation Methods Read More »

Minor and Exotic Currency Pairs

Minor and Exotic Currency Pairs A Trader’s Guide to Global Opportunities While major currency pairs like EUR/USD and GBP/USD dominate the headlines, seasoned traders often look beyond the majors to find unique opportunities in the global market. Understanding Minor and Exotic Currency Pairs can open doors to high-volatility trading strategies and portfolio diversification. At Phillip Capital DIFC, we provide access to over 40 currency pairs, allowing you to trade the world’s most dynamic economies from our regulated hub in Dubai. Whether you are hedging exposure or seeking yield, understanding the nuances of these pairs is essential for navigating the forex landscape. Table of Contents What are Minor Currency Pairs? What Defines an Exotic Currency Pair? Why Should I Consider Trading Exotic Pairs with Phillip Capital DIFC? What Are the Key Risks of Trading Exotic Currency Pairs? How Do Interest Rates Affect Minor and Exotic Pairs? Which Exotic Pairs are Popular Among Dubai Traders? How Can I Start Trading These Pairs? Conclusion What are Minor Currency Pairs? Minor currency pairs, often referred to as “crosses,” are pairs that do not include the US Dollar (USD) but do contain major currencies from other significant economies. The most common minors involve the Euro (EUR), Japanese Yen (JPY), or British Pound (GBP). For example, EUR/GBP (Euro vs. British Pound) and EUR/JPY (Euro vs. Japanese Yen) are classic minor pairs. Unlike majors, which are heavily influenced by the US economy and Federal Reserve policy, minor pairs are driven by their respective local economic data. Trading minors allows you to speculate on the strength of one economy against another without the direct noise of the US dollar. They typically offer good liquidity, though spreads can be slightly wider than the majors. What Defines an Exotic Currency Pair? Exotic currency pairs consist of one major currency (like the USD or EUR) paired with the currency of a developing or emerging economy. Examples include USD/TRY (US Dollar vs. Turkish Lira), USD/ZAR (US Dollar vs. South African Rand), and USD/SGD (US Dollar vs. Singapore Dollar). These pairs are termed “exotic” not because they are unusual, but because they are traded in lower volumes compared to majors and minors. This lower liquidity often results in higher volatility and wider spreads. However, for the strategic trader, this volatility can present significant profit opportunities—provided the risks are well-managed. Exotics are often highly sensitive to political news and economic shifts within the emerging market country. Why Should I Consider Trading Exotic Pairs with Phillip Capital DIFC? Trading exotics offers a layer of diversification that majors simply cannot match. Because these currencies are tied to emerging markets, they often move independently of the G7 economies. For instance, if the US and Europe are in a period of stagnation, an emerging market might be experiencing a resource boom, creating a strong trend in its currency. At Phillip Capital DIFC, we offer a robust trading environment for these pairs. Our MetaTrader 5 (MT5) platform provides the advanced charting tools necessary to analyze the wild swings often seen in exotics. Furthermore, as a regulated entity in the DIFC, we offer the security and transparency you need when trading volatile assets. Ready to Diversify Your Portfolio? Access over 40 currency pairs including USD/SGD and USD/CNH today Open Your Live Account What Are the Key Risks of Trading Exotic Currency Pairs? While the potential for high returns exists, the risks are equally elevated. The primary risk is liquidity risk. Because fewer people trade these pairs, it can sometimes be difficult to enter or exit a position at your exact desired price, leading to slippage. Secondly, spreads are wider. The cost of doing business is higher for exotics than for majors like EUR/USD. This means scalping strategies (making many small trades) are generally less effective; exotics are better suited for swing trading where you aim to capture larger moves. Finally, political instability in emerging markets can cause massive, sudden gaps in price, bypassing stop-loss orders. Traders must keep a close eye on geopolitical news when holding these positions How Do Interest Rates Affect Minor and Exotic Pairs? Interest rates are the heartbeat of the forex market, and this is especially true for exotics. Many emerging economies have significantly higher interest rates than the US or Europe to attract foreign investment. This creates an opportunity for a strategy known as the “Carry Trade.” For example, if you buy a currency with a high interest rate (like the South African Rand) against a currency with a low interest rate (like the Japanese Yen), you may earn the difference in interest payments every day you hold the trade, assuming the exchange rate remains stable. However, if the high-yield currency crashes, the capital loss can quickly wipe out any interest gains. Which Exotic Pairs are Popular Among Dubai Traders? Given Dubai’s position as a global trade hub, we see significant interest in pairs that connect the East and West. USD/SGD (Singapore Dollar): Popular for those looking at Asian market exposure with a stable governance backdrop. USD/CNH (Offshore Renminbi): Essential for traders tracking the Chinese economy. USD/TRY (Turkish Lira): Known for its high volatility and interest among regional traders. Additionally, many local investors track the USD/AED peg closely, though for speculative trading, they often look to non-pegged regional currencies or broader Asian exotics offered on our platform. Trade with a Regulated Broker Experience secure trading with Phillip Capital DIFC. Open An Account How Can I Start Trading These Pairs? Starting is straightforward with Phillip Capital DIFC. First, you need to ensure your account type supports the full range of CFD and Forex products. Analyze the Pair: Don’t just jump in. Use the economic calendar to check for upcoming news in the specific country (e.g., Turkey or Singapore). Check the Spread: Be aware of the transaction cost before you trade. Size Your Position Correctly: Due to higher volatility, consider trading smaller sizes on exotics compared to what you would trade on EUR/USD. We recommend checking our Market Insights section regularly for updates on global economic

Minor and Exotic Currency Pairs Read More »

Long vs Short Positions in Derivatives

Long vs Short Positions in Derivatives A Complete Guide for UAE Investors In the dynamic landscape of global finance, market volatility is the only constant. For traditional investors, a market downturn often signals a period of waiting or potential loss. However, for sophisticated traders using derivatives, market movement in any direction—whether up or down—presents an opportunity. Understanding the mechanics of Long vs Short positions is the watershed moment for many investors in the UAE. It transforms a one-dimensional investment approach into a versatile strategy capable of navigating complex economic cycles. Whether you are trading on the Dubai Gold and Commodities Exchange (DGCX) or exploring global Forex markets, mastering these positions allows you to hedge risks and capitalize on trends that others might fear. At Phillip Capital DIFC, we believe that educated traders are successful traders. This guide breaks down the technicalities of going long and short into clear, actionable insights, helping you utilize derivatives to their full potential. Table of Contents What is the fundamental difference between “Going Long” and “Going Short”? How does a Long Position work specifically within Derivatives? What is the mechanism behind a Short Position? What are the risks associated with Long vs Short positions? When should I choose a Long Strategy versus a Short Strategy? What is the fundamental difference between “Going Long” and “Going Short”? In the world of financial markets, the concepts of “long” and “short” are the two sides of the trading coin. At its simplest, going long reflects the traditional investing mindset: you buy an asset today with the expectation that its price will rise in the future. For example, if you purchase Equities or Shares in a blue-chip company listed on the DFM (Dubai Financial Market), you are taking a long position. You profit if the price goes up. Going short, or “short selling,” is the inverse. It is a strategy used when you anticipate that the price of an asset will fall. In derivatives trading—such as Futures and Options or CFDs (Contracts for Difference)—you can sell an asset you do not technically own (or sell a contract) with the intent to buy it back later at a lower price. The difference between the higher selling price and the lower buying price becomes your profit. This ability to profit from falling markets is what makes derivatives a powerful tool for sophisticated traders in the DIFC and beyond. How does a Long Position work specifically within Derivatives? While a long position in physical stocks involves ownership, a long position in derivatives is about exposure to the price movement without necessarily owning the underlying asset. When you go long on a derivative contract, such as a DGCX Gold Future, you are agreeing to buy the asset at a specific price on a future date. If the market price of gold rises above your agreed price by the time the contract expires (or when you choose to close the trade), your position gains value. This is particularly popular in Spot FX trading. If you go long on the EUR/USD pair, you are buying Euros and selling US Dollars, expecting the Euro to strengthen. The key advantage here is leverage; you can control a large position with a relatively small initial margin, amplifying potential returns (though also amplifying risks). Ready to Capitalize on Market Rises? Access global markets with competitive spreads and advanced trading tools. Open an account Contact us What is the mechanism behind a Short Position? Short positions in derivatives are often misunderstood. You aren’t “losing” an asset; you are entering a contract to sell. In an Exchange-Traded Derivative (ETD) like a future, “going short” simply means you are the seller of the contract. You agree to sell the asset at today’s price in the future. If the market price drops, the value of your contract increases because you have secured a selling price that is higher than the current market rate. In OTC (Over-the-Counter) markets like CFDs, shorting is even more seamless. You simply click “Sell” on your platform. The broker effectively lends you the asset to sell at the current high price. When you close the position, you “buy” it back. If the price has dropped, you keep the difference. This is widely used by traders to hedge portfolios—for instance, if you own physical stocks but fear a short-term market dip, you might short a stock index to offset potential losses in your physical holdings. What are the risks associated with Long vs Short positions? This is the most critical aspect for any trader to understand. Risk in Long Positions: The risk is generally capped. If you buy a crude oil contract at $80, the worst-case scenario (theoretically) is that the price falls to zero. You cannot lose more than the value of the asset (assuming no leverage). Risk in Short Positions: The risk is theoretically unlimited. If you short a stock at $100, expecting it to drop to $80, but a sudden positive news event pushes the price to $200, $300, or higher, you are responsible for covering that difference. Since there is no ceiling on how high a price can rise, losses on a short position can exceed your initial investment if not managed with strict Stop-Loss orders. At Phillip Capital DIFC, we emphasize risk management. Whether you are long or short, utilizing tools like stop-losses and understanding margin requirements is non-negotiable for sustainable trading. Master Your Risk Management Learn how to protect your capital with our expert educational resources. Speak to an Expert When should I choose a Long Strategy versus a Short Strategy? The decision depends entirely on your market outlook and your broader financial goals. Choose Long When: You identify strong fundamentals, positive economic data, or a “bullish” technical trend. It is also the primary strategy for long-term wealth accumulation in assets like equities or gold. Choose Short When: You believe an asset is overvalued (a bubble), the economic outlook is “bearish,” or you need to hedge an existing investment. For example, if you

Long vs Short Positions in Derivatives Read More »