Mean Reversion Table of Contents Introduction What Is Mean Reversion...
Read MoreMomentum Trading
Table of Contents
Introduction
Markets rarely move in straight lines — but when a strong trend takes hold, experienced traders know how to make it work in their favour. Momentum trading is one of the most widely used approaches in technical analysis, built on a straightforward idea: assets that have been rising tend to keep rising, and those falling tend to keep falling — at least for a while.
Whether you trade global equities, CFDs, or futures, understanding momentum can give you a meaningful edge. This guide breaks down everything you need to know — in plain language — so you can evaluate whether this strategy fits your trading style.
What Is Momentum Trading?
In physics, momentum means an object in motion stays in motion. In financial markets, the concept works similarly. Momentum trading is a strategy where traders buy assets that are trending upward (or sell/short those trending downward), with the expectation that the trend will continue for a period before reversing.
Rather than predicting where a price will go based on company fundamentals, momentum traders focus on where a price is already going, using historical price movement and volume as their guide. It is a core part of technical and chart-based trading strategies, sitting alongside approaches like breakout trading and moving average crossovers.
The strategy became widely recognised in the 1990s when academic research confirmed that stocks with strong recent performance tended to outperform over the following months. Today, it is used across stocks, forex, commodities, and derivatives markets globally.
How Does Momentum Trading Work in Practice?
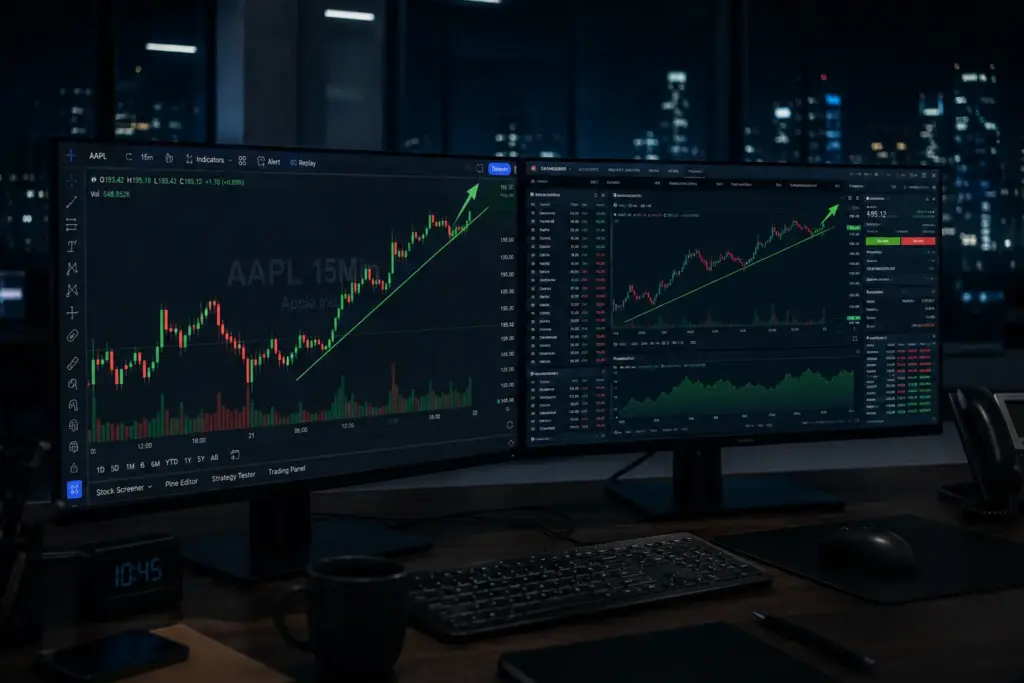
Suppose a stock has risen 15% over the past three weeks on high volume. A momentum trader does not ask “is this company worth buying at this price?” — they ask “is this uptrend strong enough to continue?” If indicators confirm strength, they enter the trade, ride the trend, and exit when signs of slowdown appear.
The typical process looks like this:
- Identify a trending asset using price action and volume
- Confirm momentum using technical indicators (see next section)
- Enter the trade in the direction of the trend
- Set a stop-loss to protect against sudden reversals
- Exit when momentum weakens or a reversal signal appears
Timing matters greatly. Entering too early — before momentum is confirmed — or too late — after the trend has exhausted itself — can result in poor returns. This is why traders pair momentum signals with disciplined risk management.
For traders accessing global equities, momentum opportunities appear frequently on platforms offering US stocks and ETFs and global non-US equities, where diverse market conditions create multiple trend-following opportunities across sectors and geographies.
Ready to Trade Global Markets?
Access trending stocks, ETFs, and global equities through a regulated broker in Dubai.
What Are the Key Indicators Used in Momentum Trading?
Several technical indicators are specifically designed to measure the speed and strength of price movement. Here are the most commonly used:
Relative Strength Index (RSI)
RSI measures how quickly prices are moving in one direction. It ranges from 0 to 100. Readings above 70 suggest an asset may be overbought (strong upward momentum), while readings below 30 suggest oversold conditions (downward momentum). Momentum traders often use RSI to confirm that a trend has real strength before entering.
Moving Average Convergence Divergence (MACD)
MACD compares two moving averages of price to show momentum direction and potential crossovers. When the MACD line crosses above the signal line, it often indicates building upward momentum — a potential buy signal. When it crosses below, the opposite may be true.
Rate of Change (ROC)
This indicator simply measures how much a price has changed over a set period. A rising ROC confirms accelerating momentum; a falling ROC may suggest the trend is losing steam.
Volume
Volume is not an oscillator, but it is vital. Strong momentum should be backed by increasing volume. If a price is rising but volume is declining, the trend may be fragile and prone to reversal.
Understanding these tools is part of a broader foundation in stock market basics and fundamental analysis, which together help traders make more informed decisions about when momentum signals are reliable.
What Markets Are Best Suited for Momentum Trading?
Does momentum trading work in all asset classes?
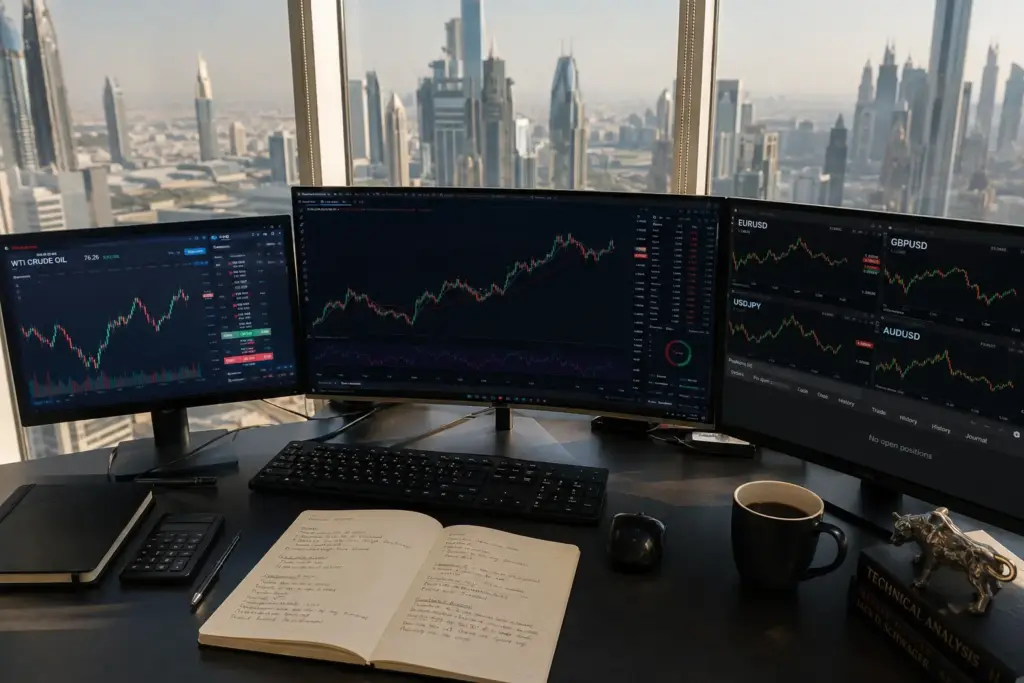
Momentum strategies can be applied across virtually every major asset class, but they tend to be most effective in liquid markets with clear, sustained trends.
Equities: Individual stocks and sector ETFs are among the best environments for momentum trading. Growth sectors like technology or energy often produce extended trends that momentum traders can capitalise on. Accessing GCC stocks alongside global markets gives traders exposure to region-specific momentum cycles.
Futures & Commodities: Commodity markets — oil, gold, agricultural products — frequently exhibit strong directional trends driven by macroeconomic forces. Futures and options trading allows traders to access these momentum-driven opportunities with leverage and precision.
CFDs and Spot FX: The forex market runs 24 hours a day and produces momentum cycles tied to central bank decisions, economic data, and geopolitical developments. CFD trading gives traders the ability to go long or short on hundreds of instruments, making it flexible for both upward and downward momentum plays.
Trade Momentum Across Asset Classes
From CFDs to futures and global equities — all in one place.
What Are the Risks of Momentum Trading?
Is momentum trading as straightforward as it sounds?
Momentum trading has real advantages — but it also carries significant risks that every trader must understand before committing capital.
Trend Reversals: The biggest risk is entering a trade just as a trend is running out of energy. Markets can reverse sharply, especially around major economic announcements or unexpected news events. Momentum signals can lag slightly, meaning a trader may enter too late in the cycle.
Overtrading: Because momentum signals can appear frequently, some traders overtrade — entering and exiting positions too often, which increases transaction costs and emotional stress.
Leverage Risk: Many momentum traders use leveraged instruments like CFDs or futures to amplify returns. While this increases potential profit, it equally amplifies losses. Understanding the full scope of leverage-related risk is outlined in our derivatives basics and futures contracts learning resources.
Market Conditions: Momentum strategies perform best in trending markets. In sideways or choppy markets, false signals are common and the strategy loses its edge. Traders need to recognise market conditions and adjust their approach accordingly.
How Do You Build a Simple Momentum Trading Plan?
A structured plan is what separates disciplined traders from impulsive ones. Here is a straightforward framework to follow:
Step 1 — Choose your market and timeframe. Decide whether you are trading equities, futures, or forex, and whether you are holding positions for hours (intraday), days (swing), or weeks (positional).
Step 2 — Select two to three indicators. A common combination is RSI + MACD + Volume. Avoid overloading your chart with indicators — they should confirm each other, not contradict.
Step 3 — Define entry rules clearly. For example: “I will enter a long trade when RSI is above 55, MACD crosses bullish, and volume is above the 20-day average.”
Step 4 — Set stop-loss and take-profit levels. Never enter a trade without knowing your exit. A common rule is to risk no more than 1–2% of your trading capital per position.
Step 5 — Review and refine. Keep a trading journal. After 20–30 trades, review what worked and what did not. Adjust your rules based on evidence, not emotion.
For traders interested in a professionally managed approach alongside their own trading, wealth management and structured notes services offer a complementary way to build a diversified portfolio.
Open a Trading Account Today
Join thousands of investors trading global markets with PhillipCapital DIFC

Conclusion & Key Takeaways
Momentum trading is one of the most accessible and powerful technical strategies available to today’s traders. By identifying assets already moving with strength and entering trades aligned with that direction, traders can benefit from sustained market trends — without needing to predict the future.
Like any strategy, success with momentum trading comes from combining the right tools, a disciplined plan, and a clear understanding of the risks involved. The markets reward preparation.
Key Takeaways:
- Momentum trading is based on the principle that trending assets tend to continue in their direction.
- Key indicators include RSI, MACD, Rate of Change, and Volume — used together for stronger signals.
- It works across stocks, futures, forex, and CFDs, but performs best in trending (not sideways) markets.
- Risk management — stop-losses, position sizing, and avoiding overtrading — is essential.
- Building a clear, rules-based trading plan is the foundation of consistent momentum trading.
- PhillipCapital DIFC offers access to global markets across multiple asset classes, giving traders the breadth they need to find and act on momentum opportunities.
Frequently Asked Questions (FAQs)
What is the best moving average for trend following?
It can be, but it requires discipline from day one. Momentum trading is rule-based and visual — you follow what the chart is showing rather than analysing company financials. That makes it approachable. However, beginners often make the mistake of entering trades too late, after the move has already happened. Start with a demo account, stick to one or two indicators, and only trade real capital once your rules are tested and consistent.
How long do you hold a position in momentum trading?
It depends on the timeframe you trade. Intraday momentum traders may hold a position for minutes to a few hours. Swing traders typically hold for two to five days. Positional momentum traders may hold for several weeks. There is no single “right” duration — what matters is exiting when your indicators show momentum is weakening, not based on a fixed time.
What is the difference between momentum trading and trend following?
They are related but not the same. Trend following is a broader, longer-term approach that stays in a trade as long as the overall direction holds — sometimes for months. Momentum trading is shorter-term and more focused on the speed and strength of a price move at a specific point. Think of trend following as the big picture and momentum trading as a more active, timed version of it.
Can momentum trading work in a falling market?
Yes. Momentum is not just about rising prices. In a declining market, traders can short an asset — betting that prices will continue to fall — using the same logic in reverse. Tools like CFDs make it straightforward to take short positions on stocks, indices, or commodities. The indicators work the same way; you are simply looking for strong downward momentum rather than upward.
Disclaimer:
Trading foreign exchange and/or contracts for difference on margin carries a high level of risk, and may not be suitable for all investors as you could sustain losses in excess of deposits. The products are intended for retail, professional and eligible counterparty clients. Before deciding to trade any products offered by PhillipCapital (DIFC) Private Limited you should carefully consider your objectives, financial situation, needs and level of experience. You should be aware of all the risks associated with trading on margin. The content of the Website must not be construed as personal advice. For retail, professional and eligible counterparty clients. Before deciding to trade any products offered by PhillipCapital (DIFC) Private Limited you should carefully consider your objectives, financial situation, needs and level of experience. You should be aware of all the risks associated with trading on margin.
Rolling Spot Contracts and CFDs are complex instruments and come with a high risk of losing money rapidly due to leverage. 78% of our retail client accounts lose money while trading with us. You should consider whether you understand how Rolling Spot Contracts and CFDs work, and whether you can afford to take the high risk of losing your money.
Trend Following Strategy
Trend Following Strategy Introduction Most traders spend years trying to...
Read More
Magic Formula (Greenblatt’s Strategy)
Magic Formula Investing A Guide to Greenblatt’s Systematic Strategy Introduction...
Read More
Rebalancing Strategy
Rebalancing Strategy Mastering Portfolio Rebalancing: A Strategic Approach to Risk...
Read More
Contrarian Investing /Dip Buying
Contrarian Investing / Dip buying Mastering the Art of Contrarian...
Read More
Growth at Reasonable Price (GARP)
Growth at Reasonable Price (GARP) Mastering Growth at Reasonable Price...
Read More
Sector Rotation Strategy
Sector Rotation A Strategic Guide to Investing Through Economic Cycles...
Read More
Dividend Growth Investing
Dividend Growth Investing Mastering Dividend Growth Investing: The Strategy for...
Read More
Growth Investing
Growth Investing The High-Risk, High-Reward Strategy for UAE Investors Growth...
Read More

Buy and Hold vs. Active Trading
Buy and Hold vs. Trading Understanding the difference in mindset...
Read More