
Bollinger Bands Strategy Introduction Every trader, at some point, asks...
Read MoreBreakout Trading
Introduction
Every experienced trader knows that markets don’t move in a straight line. Prices consolidate, compress, and build pressure — and then, at some point, they break. That moment of breaking out from a defined price range is what breakout traders live for.
Breakout trading is one of the most widely used approaches in technical and chart-based analysis. It works across markets — whether you’re trading global equities, forex pairs, commodities, or futures contracts. The core idea is straightforward: when a price breaks beyond a well-established barrier with strong momentum, it often signals the beginning of a powerful directional move.
This guide answers the most important questions about breakout trading in a practical, no-jargon way — so whether you’re a retail investor or an active market participant, you walk away with a clear and actionable understanding.
Table of Contents
- What Is Breakout Trading?
- Why Do Breakouts Happen?
- What Chart Patterns Are Used in Breakout Trading?
- How Do You Confirm a Real Breakout vs. a False One?
- How Do You Set Entry Points in a Breakout Trade?
- How Should You Manage Risk in Breakout Trading?
- What Markets Are Best Suited for Breakout Trading?
- What Are the Common Mistakes Breakout Traders Make?
- Conclusion & Key Takeaways
What Is Breakout Trading?
Breakout trading is a strategy where a trader enters a position when the price of an asset moves beyond a clearly defined support or resistance level — on higher-than-average volume and with meaningful momentum. The assumption behind this strategy is that once a strong price barrier is breached, the asset will continue moving in the same direction, often for a sustained period.
Think of it like a dam holding back water. As long as the dam holds, the water stays still. But once the dam breaks, the water moves — fast and powerfully. Breakout trading attempts to capture that surge.
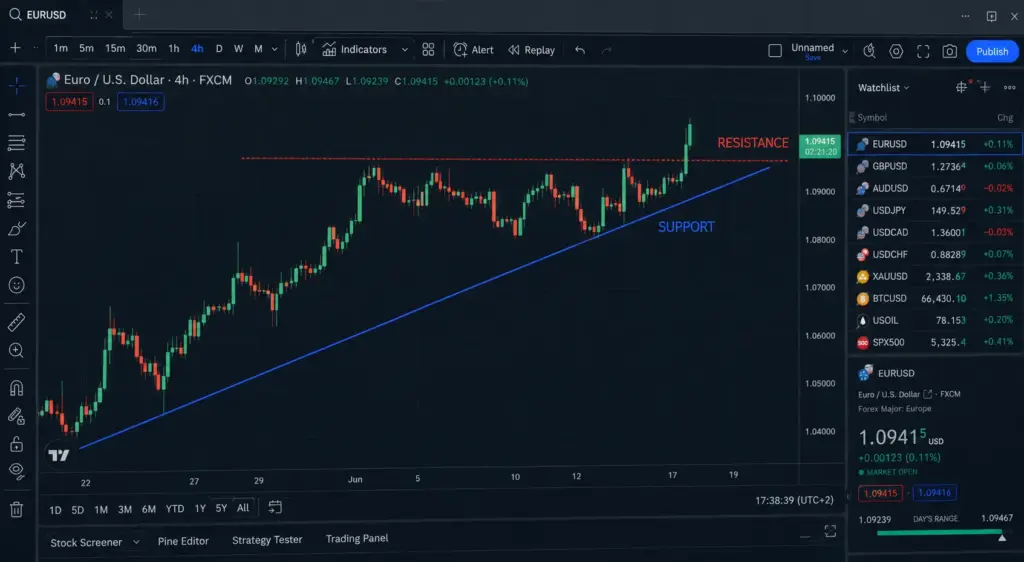
The levels traders watch most closely include horizontal resistance zones, trendline boundaries, chart pattern boundaries (such as triangles or flags), and round-number psychological levels.
Why Do Breakouts Happen?
Breakouts are a direct result of a shift in the balance between buyers and sellers in the market. Understanding the reason behind them helps traders make better decisions.
Accumulation of orders: Near key price levels, a large number of limit orders (both buy and sell) tend to cluster. When price finally reaches and clears those levels, all those pending orders get triggered simultaneously, causing a rapid price move.
News and fundamental catalysts: Earnings announcements, central bank decisions, or macroeconomic data releases often provide the trigger for a breakout. These events shift trader sentiment sharply in one direction.
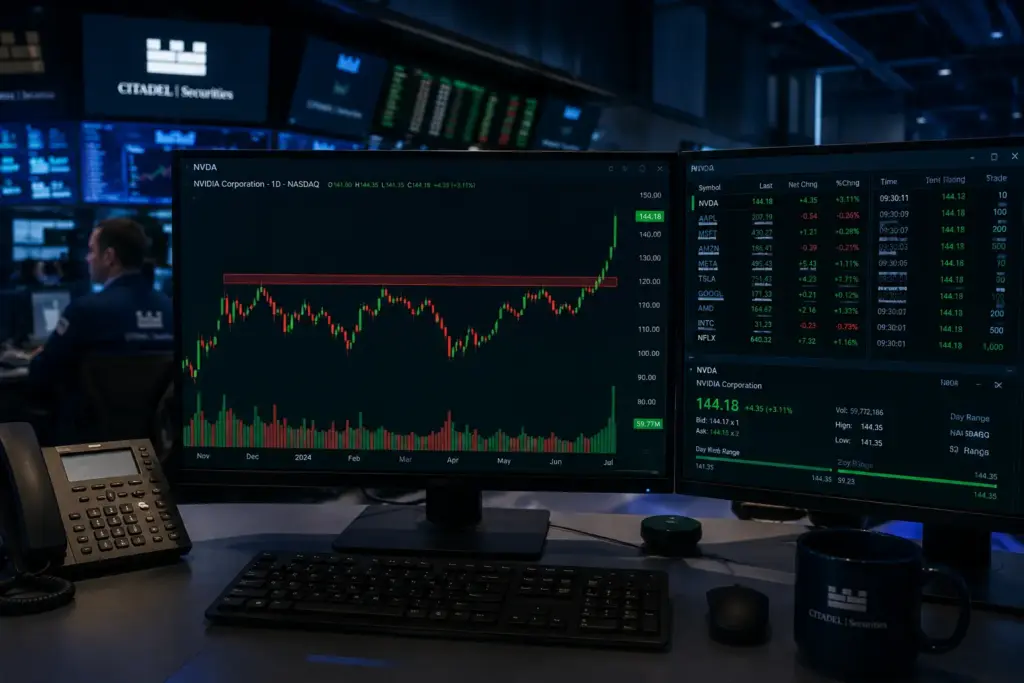
Institutional activity: Large funds and institutions often push prices through resistance levels when entering or exiting major positions. Retail traders tracking CFDs and Spot FX can often observe these footprints through volume spikes accompanying the breakout.
Market sentiment: Sometimes a breakout reflects nothing more than a collective change in how the crowd perceives an asset’s value. Momentum feeds momentum.
What Chart Patterns Are Used in Breakout Trading?
Certain chart formations are particularly well-suited for breakout setups because they visually represent price compression or consolidation before a potential explosive move.
Triangles (Ascending, Descending, and Symmetrical)
Triangles are among the most reliable breakout patterns. In an ascending triangle, price makes higher lows while resistance stays flat — signalling increasing buying pressure. A breakout above that flat resistance line is the trigger. Descending triangles show the opposite. Symmetrical triangles indicate indecision and often break in the direction of the prevailing trend.
Rectangles and Trading Ranges
When price bounces repeatedly between two horizontal levels — a ceiling (resistance) and a floor (support) — it forms a rectangle. Breakout traders wait for price to close convincingly outside this range before entering.
Flags and Pennants
These are short-term continuation patterns. After a strong initial move (the “flagpole”), price consolidates briefly in a tight range before continuing. The breakout from the flag or pennant is the entry trigger.
Cup and Handle
Common in stocks, this pattern shows a rounded bottom followed by a small consolidation. The breakout above the handle’s resistance is the entry point — often associated with strong upward follow-through.
Traders applying these patterns across global stocks and ETFs can use them on daily or weekly charts for higher-probability setups.
How Do You Confirm a Real Breakout vs. a False One?
This is arguably the most important skill in breakout trading. False breakouts — also called “fakeouts” — are very common. Price briefly moves beyond a level, triggers entries, and then reverses sharply, trapping traders on the wrong side.
Volume is the most important confirmation tool. A genuine breakout should be accompanied by a clear surge in trading volume. If volume is weak or average when the price breaks a level, be cautious. High volume indicates genuine participation from the market — not a temporary spike.
Wait for a candle close. Many breakout traders require the price candle to close beyond the level — not just pierce it — before entering. This simple filter eliminates a significant number of false signals.
Retest confirmation: After a breakout, price often pulls back briefly to “retest” the broken level — which now acts as new support (for an upside breakout) or resistance (for a downside breakout). Entering on this retest is a lower-risk approach than entering at the initial break.
Multi-timeframe alignment: If the breakout appears on a daily chart and the weekly chart also shows the same directional momentum, confidence in the trade increases significantly.
Traders using Futures & Options need particularly sharp breakout confirmation skills, since leverage amplifies both gains and losses.
Trade Global Markets Through a Regulated Dubai Broker
Access stocks, CFDs, futures, and forex with professional-grade execution
How Do You Set Entry Points in a Breakout Trade?
Timing your entry correctly is the difference between a profitable breakout trade and buying into a fakeout at the worst possible price.
Entry Method 1 – Breakout Entry (Aggressive): Place a buy stop order just above the resistance level (or a sell stop just below support). This means your order triggers automatically the moment the price crosses the key level. This approach captures the full move but carries higher fakeout risk.
Entry Method 2 – Retest Entry (Conservative): Wait for price to break the level and then pull back to retest it. Enter when the retest holds and price resumes the breakout direction. This approach offers a better risk-to-reward ratio and a more defined stop-loss level.
Entry Method 3 – On Candle Close: Wait for the candle (daily or 4-hour, depending on your timeframe) to close beyond the level before entering at the open of the next candle. This is a balanced approach preferred by many swing traders.
For traders active in GCC equity markets, where liquidity can vary, the retest entry method often reduces slippage risk considerably.
How Should You Manage Risk in Breakout Trading?
No trading strategy works without disciplined risk management. Breakout trading, because of fakeout risk, requires especially clear rules.
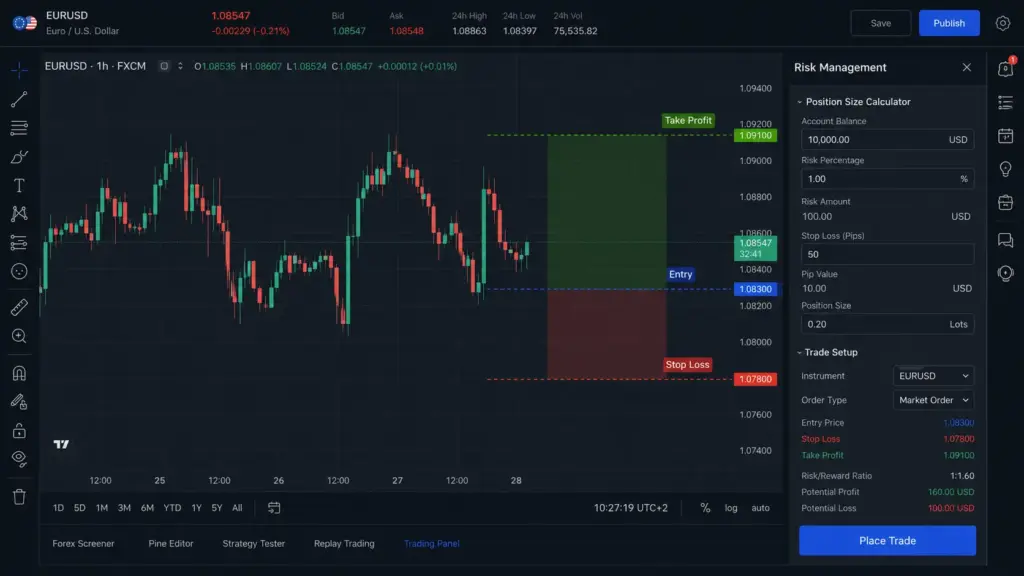
Stop-loss placement: Place your stop-loss just below the broken resistance (now support) for long trades, or above broken support (now resistance) for short trades. Some traders add a small buffer of 0.5–1% to account for minor price fluctuations.
Position sizing: Never risk more than 1–2% of your total trading capital on a single breakout trade. This rule ensures that even a series of losing trades won’t significantly damage your portfolio.
Profit targets: Use the height of the chart pattern (e.g., the triangle or rectangle) as a minimum profit target. Project that height upward from the breakout point. This is called the “measured move” technique.
Trailing stops: Once a trade moves in your favour, consider using a trailing stop to lock in profits while allowing the trend to continue running.
Traders accessing wealth management and portfolio services should integrate breakout strategies within a broader risk-managed framework rather than using them in isolation.
Trade Stocks, ETFs, and Derivatives Across 15+ Global Exchanges
PhillipCapital DIFC gives you the reach, tools, and support to trade breakouts wherever they occur.
What Markets Are Best Suited for Breakout Trading?
Breakout trading can be applied across virtually all liquid financial markets.
Stocks and ETFs: Individual stocks often produce powerful breakouts around earnings seasons or sector rotations. ETFs tracking indices like the S&P 500 provide cleaner breakout setups due to their high liquidity.
Forex (Spot FX): Major currency pairs like EUR/USD and GBP/USD frequently trade within defined ranges before breaking out on central bank news or economic data. The 24-hour nature of forex markets also means breakouts can occur at any time.
Futures: Commodity futures (gold, oil, agricultural products) and index futures are popular breakout vehicles. The leverage inherent in futures magnifies the rewards — and risks — of breakout setups.
CFDs: Contracts for Difference allow traders to take positions on breakouts across multiple asset classes without owning the underlying asset. CFD trading on indices, metals, and forex pairs is widely used for breakout strategies due to its flexibility and leverage.
Indian Markets: Breakout setups are particularly popular among traders in Indian equity and derivatives markets, where momentum-driven moves are common. PhillipCapital’s Indian equity and derivatives access makes it easier for regional investors to capitalise on these opportunities.
What Are the Common Mistakes Breakout Traders Make?
Even with a solid strategy, traders frequently fall into avoidable traps.
Chasing the breakout: Entering too late — after the price has already moved significantly beyond the breakout point — dramatically worsens the risk-to-reward ratio.
Ignoring volume: Trading a breakout that occurs on weak volume is one of the most common ways traders get caught in a fakeout.
Over-trading: Not every consolidation leads to a meaningful breakout. Disciplined traders are selective, waiting for high-quality setups on clean chart structures.
Skipping the stop-loss: Some traders place a trade without a stop-loss, hoping to “ride it out” if the breakout fails. This approach is particularly dangerous in leveraged products.
Trading against the trend: A breakout setup in the direction of the broader market trend has a significantly higher probability of success than a counter-trend setup.
Understanding the foundations of chart reading and stock market basics is essential before applying advanced breakout strategies in live markets.
Conclusion & Key Takeaways
Breakout trading is a powerful, time-tested approach that gives traders a structured way to identify and act on moments of high market momentum. When applied with discipline, proper confirmation, and sound risk management, it can be effective across equities, forex, futures, and CFD markets.
The strategy is not about predicting the future — it is about recognising when market conditions have shifted in a measurable, tradeable way and acting on that information with a clear plan.
Key Takeaways:
- A breakout occurs when price moves beyond a defined support or resistance level with conviction and volume.
- Volume confirmation is critical — a breakout without volume is a warning sign.
- Wait for candle closes or retest entries to filter out false breakouts.
- Always place a stop-loss at a logical level and define your profit target before entering.
- Breakout strategies work across stocks, forex, futures, and CFDs — but require market-specific awareness.
- Avoid chasing moves, over-trading, and counter-trend setups.
- Risk only 1–2% of your capital per trade and use measured moves to set realistic targets.
Whether you are a retail investor or a professional trader operating from Dubai or anywhere in the region, applying these principles with the right brokerage infrastructure behind you can make a meaningful difference in your trading outcomes.
Open an Account with PhillipCapital DIFC — DFSA Regulated
Access global markets with professional tools, competitive execution, and a trusted broker serving investors since 1975.

Frequently Asked Questions (FAQs)
Is breakout trading profitable?
Yes — but only when applied with discipline. Breakout trading can be highly profitable because it captures the early stage of a strong price move. The key is filtering out false breakouts using volume confirmation and waiting for a candle close beyond the level. Traders who enter impulsively on every “break” without confirmation tend to lose consistently. Those who are selective and patient tend to see better results over time.
What is the best timeframe for breakout trading?
There is no universal answer, but the daily and 4-hour charts are most commonly used by swing and position traders. These timeframes tend to produce cleaner, more reliable setups. Day traders often use the 15-minute or 1-hour charts. As a general rule — the higher the timeframe, the more significant the breakout level, and the stronger the expected move.
How do I avoid getting trapped in a false breakout?
Three habits help significantly. First, always check volume — a genuine breakout is backed by a clear surge in trading activity. Second, wait for the candle to close beyond the level rather than entering the moment price touches it. Third, look for a retest of the broken level before entering — if price breaks resistance, pulls back, and holds that level as new support, that is a much stronger signal than the initial break alone.
Does breakout trading work in all markets?
Breakout setups appear in every liquid market — stocks, forex, futures, commodities, and CFDs. However, effectiveness varies by market conditions. Breakout strategies perform best in trending markets with clear price structure. They tend to underperform in choppy, sideways, or low-volatility markets, where false breakouts are more frequent. Always assess the broader market context before applying the strategy.
Disclaimer:
Trading foreign exchange and/or contracts for difference on margin carries a high level of risk, and may not be suitable for all investors as you could sustain losses in excess of deposits. The products are intended for retail, professional and eligible counterparty clients. Before deciding to trade any products offered by PhillipCapital (DIFC) Private Limited you should carefully consider your objectives, financial situation, needs and level of experience. You should be aware of all the risks associated with trading on margin. The content of the Website must not be construed as personal advice. For retail, professional and eligible counterparty clients. Before deciding to trade any products offered by PhillipCapital (DIFC) Private Limited you should carefully consider your objectives, financial situation, needs and level of experience. You should be aware of all the risks associated with trading on margin.
Rolling Spot Contracts and CFDs are complex instruments and come with a high risk of losing money rapidly due to leverage. 78% of our retail client accounts lose money while trading with us. You should consider whether you understand how Rolling Spot Contracts and CFDs work, and whether you can afford to take the high risk of losing your money.
Moving Average Crossover
Moving Average Crossover Introduction Every trader, whether new or experienced,...
Read More
Support-Resistance Bounce
Support/Resistance Bounce Table of Contents Introduction What Is Support and...
Read More
Breakout Trading
Breakout Trading Introduction Every experienced trader knows that markets don’t...
Read More
Trend Following Strategy
Trend Following Strategy Introduction Most traders spend years trying to...
Read More
Magic Formula (Greenblatt’s Strategy)
Magic Formula Investing A Guide to Greenblatt’s Systematic Strategy Introduction...
Read More
Rebalancing Strategy
Rebalancing Strategy Mastering Portfolio Rebalancing: A Strategic Approach to Risk...
Read More
Contrarian Investing /Dip Buying
Contrarian Investing / Dip buying Mastering the Art of Contrarian...
Read More
Growth at Reasonable Price (GARP)
Growth at Reasonable Price (GARP) Mastering Growth at Reasonable Price...
Read More
Sector Rotation Strategy
Sector Rotation A Strategic Guide to Investing Through Economic Cycles...
Read More
Dividend Growth Investing
Dividend Growth Investing Mastering Dividend Growth Investing: The Strategy for...
Read More
Growth Investing
Growth Investing The High-Risk, High-Reward Strategy for UAE Investors Growth...
Read More

Buy and Hold vs. Active Trading
Buy and Hold vs. Trading Understanding the difference in mindset...
Read More