
Bollinger Bands Strategy Introduction Every trader, at some point, asks...
Read MoreMoving Average Crossover

Introduction
Every trader, whether new or experienced, is constantly looking for reliable signals that tell them when to enter or exit a trade. One of the most widely used tools for this purpose is the Moving Average Crossover. It is simple to understand, applies to almost every market, and has stood the test of time across decades of trading.
Whether you are trading US stocks and ETFs, exploring CFDs and Spot FX, or building a broader investment strategy, understanding how crossovers work can give you a meaningful edge. This guide answers the most important questions about Moving Average Crossovers in plain, practical language.
What Is a Moving Average?
A moving average (MA) is simply the average price of an asset over a set number of past periods — days, hours, or minutes. It smooths out the noise in price movements so you can see the overall direction more clearly.
There are two main types:
Simple Moving Average (SMA): Adds up closing prices over a period and divides by the number of periods. For example, a 50-day SMA adds the last 50 days of closing prices and divides by 50.
Exponential Moving Average (EMA): Gives more weight to recent prices, making it faster to react to new market developments. Traders who need quicker signals often prefer EMAs.
Both types are widely used and available on most trading platforms. If you are just getting started, understanding stock market basics will help you place moving averages in the right context before applying them to live trades.
What Is a Moving Average Crossover?
A Moving Average Crossover happens when a shorter-period moving average crosses over a longer-period moving average on a price chart. This crossing point is treated as a potential signal for a change in trend direction.
The Bullish Crossover (Buy Signal)
When the short-term MA crosses above the long-term MA, it signals that recent prices are rising faster than the historical average. This is often interpreted as a buy signal, suggesting the asset may be entering an uptrend.
The Bearish Crossover (Sell Signal)
When the short-term MA crosses below the long-term MA, it signals that recent prices are falling relative to the historical average. This is generally seen as a sell signal or a prompt to exit a long position.
The crossover itself does not guarantee a profitable trade — no indicator ever does. But it provides a structured, rules-based way to act on trend changes rather than relying on gut feel.
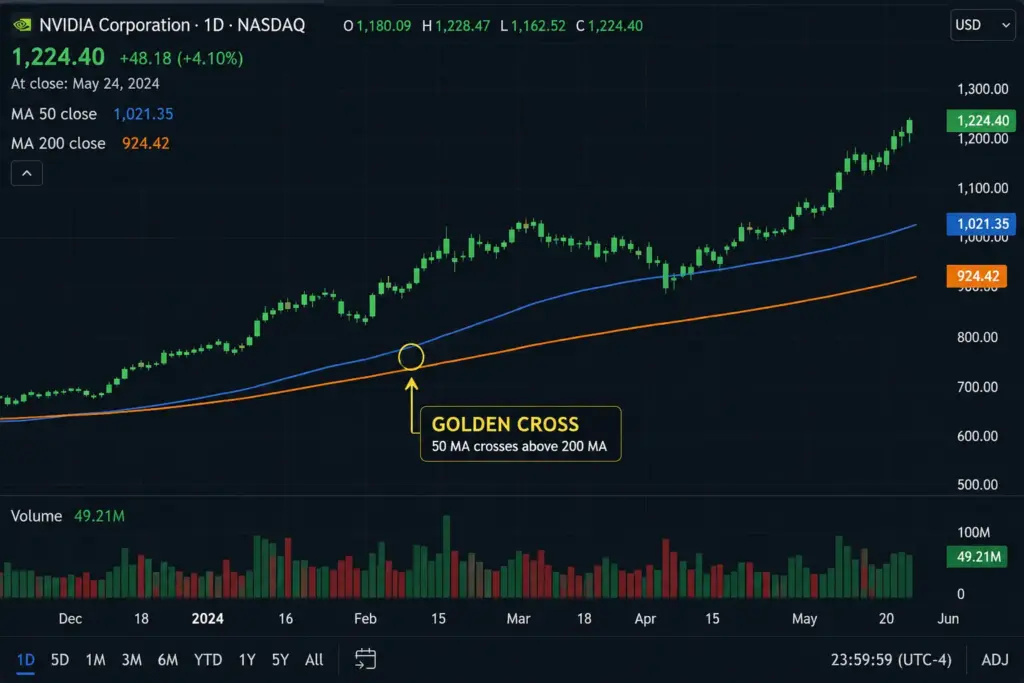
What Are the Golden Cross and Death Cross?
These are two famous crossover patterns that get significant attention from traders and financial media alike.
The Golden Cross
A Golden Cross occurs when the 50-day moving average crosses above the 200-day moving average. It is widely considered a long-term bullish signal, suggesting that a sustained uptrend may be developing. Institutional investors and fund managers pay close attention to this pattern when making allocation decisions across global equity markets.
The Death Cross
The Death Cross is the opposite: the 50-day MA crosses below the 200-day MA. It signals a potential long-term downtrend and is often used as a prompt to reduce exposure or shift toward defensive assets.
Both signals work across asset classes — equities, forex, commodities, and indices.
Ready to Apply Chart Strategies Across Global Markets?
Access equities, CFDs, futures, and more — all from one regulated platform in Dubai.
Which Moving Average Periods Should You Use?
There is no single “correct” answer — the right periods depend on your trading style and time horizon.
Short-term traders (day traders, swing traders): Commonly use the 5-day and 20-day MAs, or even shorter periods like 9 and 21 on intraday charts. These react quickly to price changes but also produce more false signals.
Medium-term traders: The 20-day and 50-day combination is a popular choice for capturing trends that last several weeks.
Long-term investors: The 50-day and 200-day pairing (as in the Golden/Death Cross) is most appropriate. This combination filters out short-term noise and focuses on major trend shifts.
For currency traders using Spot FX and CFDs, EMAs on shorter timeframes (e.g., 12 and 26 periods) are commonly used because forex markets move fast and EMA’s sensitivity to recent price action is an advantage.

What Are the Limitations of This Strategy?
Understanding the weaknesses of a strategy is just as important as knowing when it works.
Lagging by nature: Moving averages are based on past prices, so crossovers always happen after a trend has already begun. You will rarely catch the very top or bottom.
Whipsaws in sideways markets: When prices move in a tight range without a clear trend, moving averages cross back and forth repeatedly, generating false buy and sell signals. This can lead to a series of small losses.
Not a standalone system: Relying solely on crossovers without confirming with volume, support/resistance levels, or other indicators increases risk. Many experienced traders combine this tool with derivatives and futures strategies to hedge exposure and manage downside risk.
Being aware of these limitations helps you use the tool more wisely rather than abandoning it because of occasional false signals.
How Do You Combine This Strategy with Other Tools?
Professional traders rarely use a single indicator. Moving Average Crossovers are most effective when combined with:
Volume analysis: A crossover backed by rising volume carries more weight. A signal on low volume may be unreliable.
RSI (Relative Strength Index): If a bullish crossover happens while RSI is below 30 (oversold territory), the buy signal is stronger. Conversely, a bearish crossover while RSI is above 70 (overbought) strengthens the sell case.
Support and Resistance levels: If a bullish crossover occurs right at a key support level, confidence in the trade increases significantly.
Fundamental context: For equity investors, technical signals are most actionable when the underlying company or sector also shows healthy fundamentals. PhillipCapital’s stock valuations and fundamental analysis resources can complement your chart-based approach.
The goal is not to use every indicator available — it is to build a consistent framework where multiple tools confirm the same story before you act.
Want to Trade Derivatives with Chart-Based Precision?
Access global futures and options markets through a DFSA-regulated broker
Conclusion & Key Takeaways
The Moving Average Crossover is one of the most accessible and enduring tools in technical analysis. It does not require complex mathematics or expensive software — just a clear understanding of what the signals mean and the discipline to apply them consistently.
Key Takeaways:
- A crossover occurs when a short-term MA crosses above or below a long-term MA, signalling potential trend changes.
- The Golden Cross (50-day above 200-day) is a bullish long-term signal; the Death Cross is its bearish counterpart.
- The best period settings depend on your trading style — scalpers use short periods, long-term investors use longer ones.
- Moving averages are lagging indicators. Always combine them with volume, price levels, or other indicators before acting.
- Crossover signals are most reliable in trending markets and least reliable in choppy, sideways conditions.
- Technical strategies work best when layered with fundamental knowledge and sound risk management.
At PhillipCapital DIFC, we provide investors and traders access to global markets with the tools, research, and support needed to trade with greater confidence. Whether you are building a position in GCC equities or exploring wealth management solutions, having a solid technical foundation strengthens every decision you make.
Frequently Asked Questions (FAQs)
Is the Moving Average Crossover strategy actually profitable?
It can be — but not on its own. The crossover works best in trending markets where prices move clearly in one direction. In sideways or choppy markets, it generates frequent false signals and small losses. Traders who get the best results from it use it as a filter or confirmation tool alongside volume, RSI, or price action, rather than treating it as a complete trading system.
What is the best moving average combination to use?
There is no universal answer — it depends on your timeframe and style. The most widely used combinations are 9 & 21 for short-term trading, 20 & 50 for swing trading, and 50 & 200 for long-term trend following. As a starting point, the 50/200 combination is the most respected because institutional traders also watch it, which makes the signals more meaningful.
Does the crossover work the same way on stocks, forex, and crypto?
Yes — the logic applies across all markets. However, the settings and timeframes matter. Forex and crypto move faster, so shorter EMA periods (like 9 & 21) are more commonly used. For stocks and indices, longer SMA periods (50 & 200) tend to produce more reliable signals. The asset’s volatility level should always guide your period selection.
How do I avoid false crossover signals?
The most practical approach is to wait for confirmation. Instead of acting the moment two MAs cross, wait for the closing price to firmly close on the expected side of the crossover. Checking RSI and volume at the same time helps filter out weak signals. Many traders also avoid acting on crossovers when the market is clearly range-bound with no trend in sight.
Start Trading Smarter Today
Join thousands of investors who trust PhillipCapital DIFC for regulated global market access.

Disclaimer:
Trading foreign exchange and/or contracts for difference on margin carries a high level of risk, and may not be suitable for all investors as you could sustain losses in excess of deposits. The products are intended for retail, professional and eligible counterparty clients. Before deciding to trade any products offered by PhillipCapital (DIFC) Private Limited you should carefully consider your objectives, financial situation, needs and level of experience. You should be aware of all the risks associated with trading on margin. The content of the Website must not be construed as personal advice. For retail, professional and eligible counterparty clients. Before deciding to trade any products offered by PhillipCapital (DIFC) Private Limited you should carefully consider your objectives, financial situation, needs and level of experience. You should be aware of all the risks associated with trading on margin.
Rolling Spot Contracts and CFDs are complex instruments and come with a high risk of losing money rapidly due to leverage. 78% of our retail client accounts lose money while trading with us. You should consider whether you understand how Rolling Spot Contracts and CFDs work, and whether you can afford to take the high risk of losing your money.
Moving Average Crossover
Moving Average Crossover Introduction Every trader, whether new or experienced,...
Read More
Support-Resistance Bounce
Support/Resistance Bounce Table of Contents Introduction What Is Support and...
Read More
Breakout Trading
Breakout Trading Introduction Every experienced trader knows that markets don’t...
Read More
Trend Following Strategy
Trend Following Strategy Introduction Most traders spend years trying to...
Read More
Magic Formula (Greenblatt’s Strategy)
Magic Formula Investing A Guide to Greenblatt’s Systematic Strategy Introduction...
Read More
Rebalancing Strategy
Rebalancing Strategy Mastering Portfolio Rebalancing: A Strategic Approach to Risk...
Read More
Contrarian Investing /Dip Buying
Contrarian Investing / Dip buying Mastering the Art of Contrarian...
Read More
Growth at Reasonable Price (GARP)
Growth at Reasonable Price (GARP) Mastering Growth at Reasonable Price...
Read More
Sector Rotation Strategy
Sector Rotation A Strategic Guide to Investing Through Economic Cycles...
Read More
Dividend Growth Investing
Dividend Growth Investing Mastering Dividend Growth Investing: The Strategy for...
Read More
Growth Investing
Growth Investing The High-Risk, High-Reward Strategy for UAE Investors Growth...
Read More

Buy and Hold vs. Active Trading
Buy and Hold vs. Trading Understanding the difference in mindset...
Read More