

Bollinger Bands Strategy Introduction Every trader, at some point, asks...
Read MoreTrend Following Strategy
Introduction
Most traders spend years trying to predict where the market will go next. Trend following takes a different and often more practical approach — instead of guessing, you simply observe where the market is already going and move with it.
The core idea is straightforward: when prices are consistently rising, you buy. When prices are consistently falling, you sell short. You stay in the trade as long as the trend continues and exit when signs of a reversal appear. It sounds simple, but doing it well requires discipline, the right tools, and a clear understanding of how trends form and end.
This guide breaks down trend following in plain language — what it is, how it works, which tools traders use, and how to apply it across different markets.
What Is Trend Following?
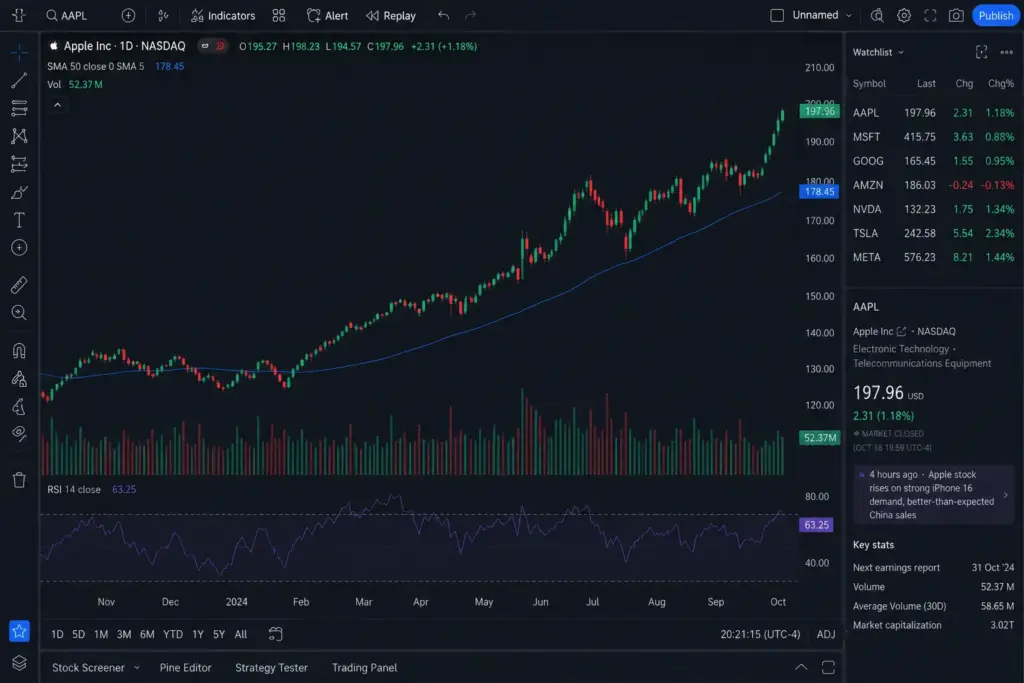
Trend following is a trading approach where you align your trades with the direction the market is already moving. If the market is in an uptrend — meaning prices are making higher highs and higher lows — a trend follower buys and holds until the trend weakens. In a downtrend — where prices are making lower highs and lower lows — a trend follower sells short and profits as prices continue to fall.
The philosophy behind this is simple: markets move in trends more often than they reverse. A rising stock, a strengthening currency, or a climbing commodity price tends to keep moving in the same direction for a period of time before it changes course. Trend followers aim to capture that sustained middle portion of the move.
It is worth noting that trend following does not try to catch the very bottom or the very top. The goal is to get in once the trend is confirmed, ride the move, and exit before too much of the gains are lost.
How Do You Identify a Market Trend?
A trend is not just a day or two of price movement. It refers to a sustained directional move over a meaningful period — weeks, months, or even longer. To confirm a trend, traders look at price structure and supporting indicators.
Price Structure: In an uptrend, each new high is higher than the last, and each pullback stays above the previous low. In a downtrend, the opposite is true. This pattern of higher highs and higher lows (or lower highs and lower lows) is the most reliable sign of a trend.
Trendlines: Drawing a line along the swing lows in an uptrend (or swing highs in a downtrend) helps visualise the trend’s direction and strength. As long as price holds above an upward trendline, the trend is considered intact.
Volume: In healthy trends, rising prices are usually supported by increasing volume. A trend that continues with declining volume may be running out of energy.
Understanding price structure is a foundational part of stock market basics and applies across equities, commodities, indices, and currency markets alike.
What Tools Do Trend Followers Use?
Moving Averages
Moving averages are among the most widely used tools in trend following. They smooth out price fluctuations and show the average price over a defined period, making the underlying direction much easier to see.
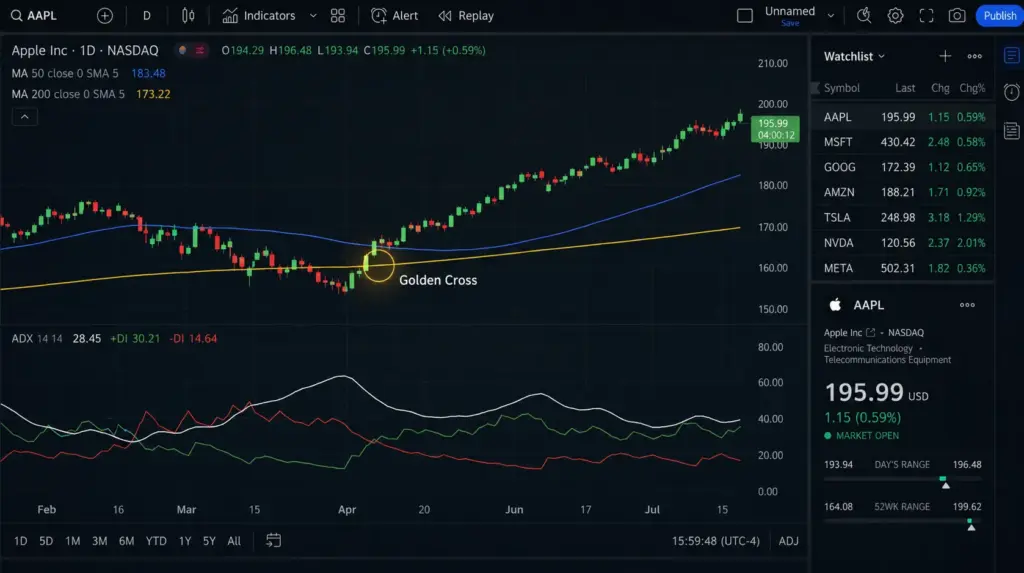
The 50-day and 200-day moving averages are particularly popular. When price trades above both, the trend is considered bullish. When price crosses below the 200-day moving average, it often signals a shift to a downtrend. A common signal is the Golden Cross (50-day crosses above the 200-day — bullish) and the Death Cross (50-day crosses below the 200-day — bearish).
Trendlines and Channels
Trendlines connect successive highs or lows and act as dynamic levels of support or resistance. A price channel adds a parallel line to contain the trend and gives traders a visible range to work within.
The ADX Indicator
The Average Directional Index (ADX) measures trend strength rather than direction. An ADX reading above 25 typically confirms a strong trend, while readings below 20 suggest a sideways, trendless market where trend following strategies are less effective.
How Do You Enter and Exit a Trend Trade?
Entry is best taken after the trend is confirmed — not before. Many traders wait for price to pull back slightly toward a moving average or trendline and then enter as price resumes in the trend direction. This approach gives a better entry price and reduces the risk of entering at a peak.
Stop-Loss Placement is critical. A stop-loss is typically placed just below the most recent swing low in an uptrend (or above the swing high in a downtrend). If price breaks that level, it signals the trend may be reversing.
Exit should be planned in advance. Trend followers commonly exit when price crosses back below a key moving average, when the ADX begins to fall sharply, or when a clear trend reversal pattern appears on the chart.
Traders who apply trend following to leveraged instruments like CFDs or futures and options must manage position sizing carefully, as leverage amplifies both gains and losses.
Ready to Apply Trend Following in Live Markets?
Access equities, CFDs, futures, and forex — all from one regulated platform.
What Markets Work Best for Trend Following?
Trend following can be applied to virtually any liquid market, but it tends to perform best in markets that experience sustained directional moves. These include:
Global Equities: Major stocks and indices often trend for extended periods, especially during bull markets. Traders with access to US stocks and ETFs or global equity markets can apply trend strategies across a wide opportunity set.
Commodities and Futures: Energy prices, metals, and agricultural commodities frequently exhibit multi-week and multi-month trends driven by supply-demand dynamics and macroeconomic factors.
Foreign Exchange (Forex): Currency pairs driven by interest rate differentials and central bank policy often develop clean, identifiable trends over weeks or months.
The strategy tends to underperform in choppy, range-bound markets where prices oscillate without a clear direction — which is why confirming trend strength before entering is essential.
What Are the Risks of Trend Following?
No trading strategy is without risk, and trend following is no exception.
False Breakouts: Sometimes a price appears to break into a new trend but quickly reverses. This is called a false breakout or a “whipsaw.” Traders who enter too early can face repeated small losses.
Late Entries: By the time a trend is confirmed, a portion of the move has already occurred. Trend followers often miss the beginning of a trend in exchange for higher confidence in its direction.
Drawdowns During Consolidation: In periods of low volatility or sideways price action, trend-following strategies may generate a series of small losses as the market fails to establish a clear direction.
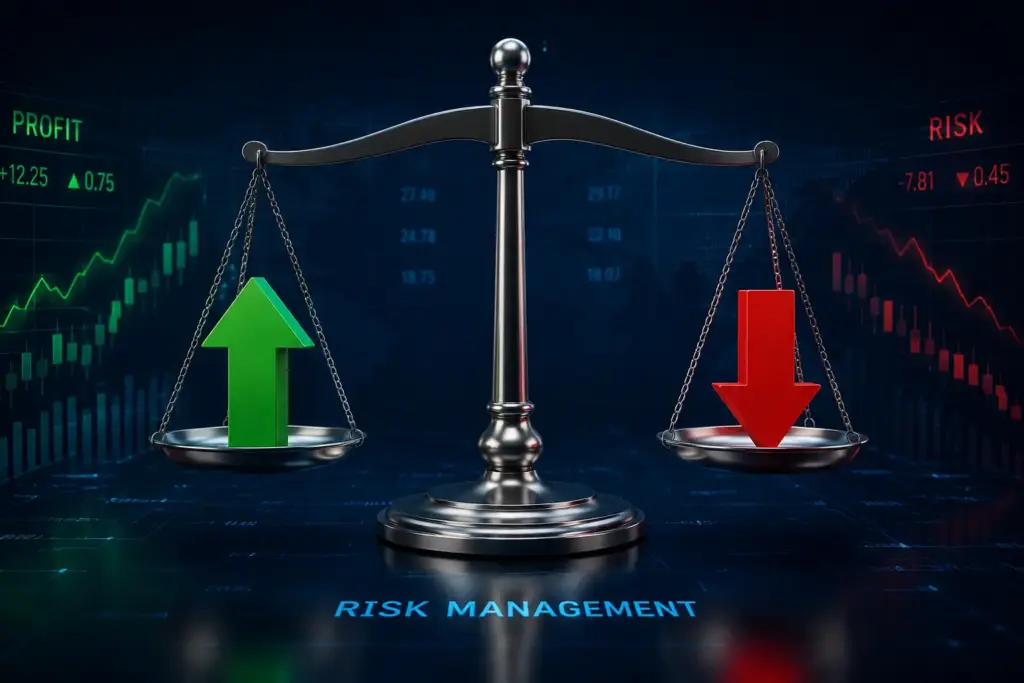
Proper risk management — including position sizing, stop-loss orders, and never risking more than a defined percentage of capital per trade — is fundamental to long-term success. For investors newer to this, exploring derivatives basics can provide useful context on how leveraged instruments behave in different market conditions.
Is Trend Following Right for You?
Trend following suits traders who are patient, disciplined, and comfortable holding positions for days or weeks rather than minutes. It is not a strategy that generates a signal on every single day — sometimes the best move is to wait for a clear trend to form before committing capital.
It works well for those who prefer a rules-based approach: defined entry signals, clear stop-loss levels, and a systematic exit plan. Emotional decision-making is the biggest enemy of trend following — the strategy only works when followed consistently.
Whether you are trading global equities, currencies, or commodities through instruments like CFDs or futures, having access to a reliable, multi-asset platform is essential to executing trend strategies efficiently.
Start Trading with a Regulated Broker
PhillipCapital DIFC is regulated by the DFSA and offers access to global markets from Dubai.

Conclusion & Key Takeaways
Trend following is one of the most time-tested approaches in active trading. It does not require predicting the future — it requires reading the present clearly and acting with discipline. Here is what to remember:
- A trend is confirmed by consistent price structure: higher highs and higher lows in an uptrend, and the reverse in a downtrend.
- Moving averages (especially the 50-day and 200-day) are the most practical tools for confirming trend direction.
- Enter after confirmation, not before; use a stop-loss to protect capital if the trend reverses.
- Trend following works best in trending markets — it underperforms in sideways, choppy conditions.
- Risk management is non-negotiable. No trend lasts forever, and knowing when to exit is just as important as knowing when to enter.
- The strategy suits patient, disciplined traders who follow their rules consistently.
Whether you are building your knowledge through the trading strategies section or ready to apply these concepts in live markets through CFDs or global equities, the foundation remains the same: follow the trend, manage your risk, and stay disciplined.
Frequently Asked Questions (FAQs)
Does trend following actually work, or is it just following the herd?
Trend following does work — and it is backed by decades of real trading data. The strategy is not about blindly following the crowd. It is about recognising that markets move in sustained directions due to fundamental and psychological forces, and positioning yourself accordingly. The key is using objective tools like moving averages to confirm the trend, not gut feeling. That said, it requires discipline — it fails when traders override their rules emotionally.
What is the best moving average for trend following?
There is no single “best” moving average, but the 50-day and 200-day simple moving averages are the most widely used and respected. The 200-day MA is particularly popular for identifying the long-term trend direction. Many traders combine both — when price stays above both lines, the trend is considered bullish. Shorter MAs like the 20-day work better for swing traders who hold positions for days rather than weeks.
How do you know when a trend is over?
A trend shows signs of ending when price breaks below a key moving average, when the ADX indicator drops sharply from a high reading, or when the market starts making lower highs in an uptrend. A single red day does not end a trend — but a consistent pattern of weakening momentum does. Most experienced trend traders exit when price closes below the 50-day or 200-day MA on meaningful volume.
Can beginners use trend following, or is it only for experienced traders?
Trend following is actually one of the more beginner-friendly strategies because the rules are clear and objective — you either have a confirmed trend or you do not. There is no complex forecasting involved. Beginners should start by practising on a demo account, focusing on one or two markets, and keeping position sizes small until they are comfortable reading trend signals and managing stop-losses confidently.
Disclaimer:
Trading foreign exchange and/or contracts for difference on margin carries a high level of risk, and may not be suitable for all investors as you could sustain losses in excess of deposits. The products are intended for retail, professional and eligible counterparty clients. Before deciding to trade any products offered by PhillipCapital (DIFC) Private Limited you should carefully consider your objectives, financial situation, needs and level of experience. You should be aware of all the risks associated with trading on margin. The content of the Website must not be construed as personal advice. For retail, professional and eligible counterparty clients. Before deciding to trade any products offered by PhillipCapital (DIFC) Private Limited you should carefully consider your objectives, financial situation, needs and level of experience. You should be aware of all the risks associated with trading on margin.
Rolling Spot Contracts and CFDs are complex instruments and come with a high risk of losing money rapidly due to leverage. 78% of our retail client accounts lose money while trading with us. You should consider whether you understand how Rolling Spot Contracts and CFDs work, and whether you can afford to take the high risk of losing your money.
Moving Average Crossover
Moving Average Crossover Introduction Every trader, whether new or experienced,...
Read More
Support-Resistance Bounce
Support/Resistance Bounce Table of Contents Introduction What Is Support and...
Read More
Breakout Trading
Breakout Trading Introduction Every experienced trader knows that markets don’t...
Read More

Trend Following Strategy
Trend Following Strategy Introduction Most traders spend years trying to...
Read More

Magic Formula (Greenblatt’s Strategy)
Magic Formula Investing A Guide to Greenblatt’s Systematic Strategy Introduction...
Read More
Rebalancing Strategy
Rebalancing Strategy Mastering Portfolio Rebalancing: A Strategic Approach to Risk...
Read More
Contrarian Investing /Dip Buying
Contrarian Investing / Dip buying Mastering the Art of Contrarian...
Read More
Growth at Reasonable Price (GARP)
Growth at Reasonable Price (GARP) Mastering Growth at Reasonable Price...
Read More
Sector Rotation Strategy
Sector Rotation A Strategic Guide to Investing Through Economic Cycles...
Read More
Dividend Growth Investing
Dividend Growth Investing Mastering Dividend Growth Investing: The Strategy for...
Read More
Growth Investing
Growth Investing The High-Risk, High-Reward Strategy for UAE Investors Growth...
Read More

Buy and Hold vs. Active Trading
Buy and Hold vs. Trading Understanding the difference in mindset...
Read More