
Bollinger Bands Strategy Introduction Every trader, at some point, asks...
Read MoreMean Reversion
Introduction
Every trader has watched a stock shoot up 15% in a week — only to fall right back to where it started. Or seen a currency pair collapse on bad news, then quietly recover within days. That “rubber band” effect is not random. It is the principle of mean reversion at work.
Mean reversion is one of the most widely used chart-based strategies in professional trading. It does not rely on predicting the future direction of a market — instead, it bets on a simple, observable truth: prices that stray too far from their average tend to come back. Understanding how to identify and trade these setups can give both retail and institutional investors a consistent, rules-based edge.
What Is Mean Reversion in Trading?
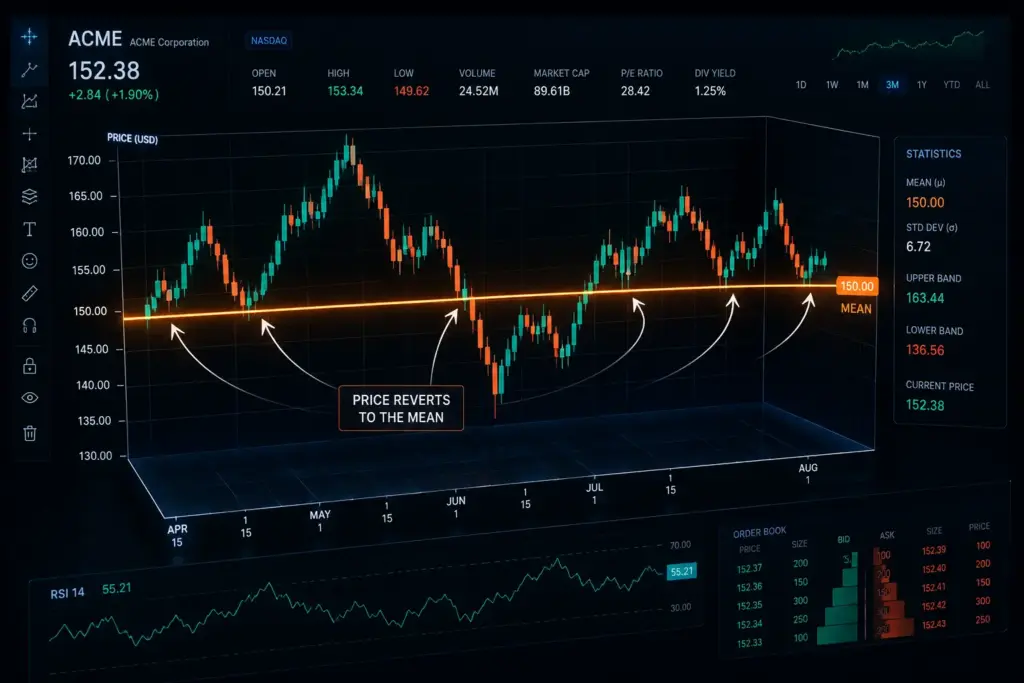
Simply put: if a price moves too far from its “normal” level, it will likely return to that level over time.
Every asset — whether a stock, a currency pair, a commodity, or an index — trades around an average price over any given period. That average acts like a gravitational centre. When news, sentiment, or a spike in volume pushes the price far above or below that centre, the market tends to self-correct.
This is what traders call mean reversion: the tendency of an asset’s price to move back toward its historical average after an extreme move.
The “mean” here refers to the statistical average of prices over a defined lookback period — commonly 20, 50, or 200 days. The further an asset drifts from this average, the stronger the pull back toward it is expected to be.
What Is the Core Idea Behind Mean Reversion?
The strategy is built on identifying “overextended” price moves — and trading the return journey.
When a market is moving normally, its price stays relatively close to its moving average. But extreme moves — triggered by earnings surprises, geopolitical events, or panic selling — can push prices to levels that are statistically unusual. Mean reversion traders look for these extremes and position themselves for the correction.
Here is how the logic works in practice:
- A stock rises 20% in three days with no change in fundamentals → it may be overbought → a mean reversion trader may consider shorting or waiting for a reversal signal.
- A currency pair drops sharply on a rumour that is later denied → the market overcorrected → a mean reversion trader might look for a long entry near strong support.
The strategy works across different time frames. Day traders use it on 5-minute or 15-minute charts. Swing traders apply it over days or weeks. Long-term investors may use it to find entry points in fundamentally strong assets that have temporarily sold off. If you are exploring trading strategies more broadly, understanding both trend-following and mean reversion approaches gives you a more complete toolkit.
Which Indicators Are Used for Mean Reversion?
The most effective mean reversion traders don’t rely on guesswork — they use specific technical indicators to identify stretched conditions.
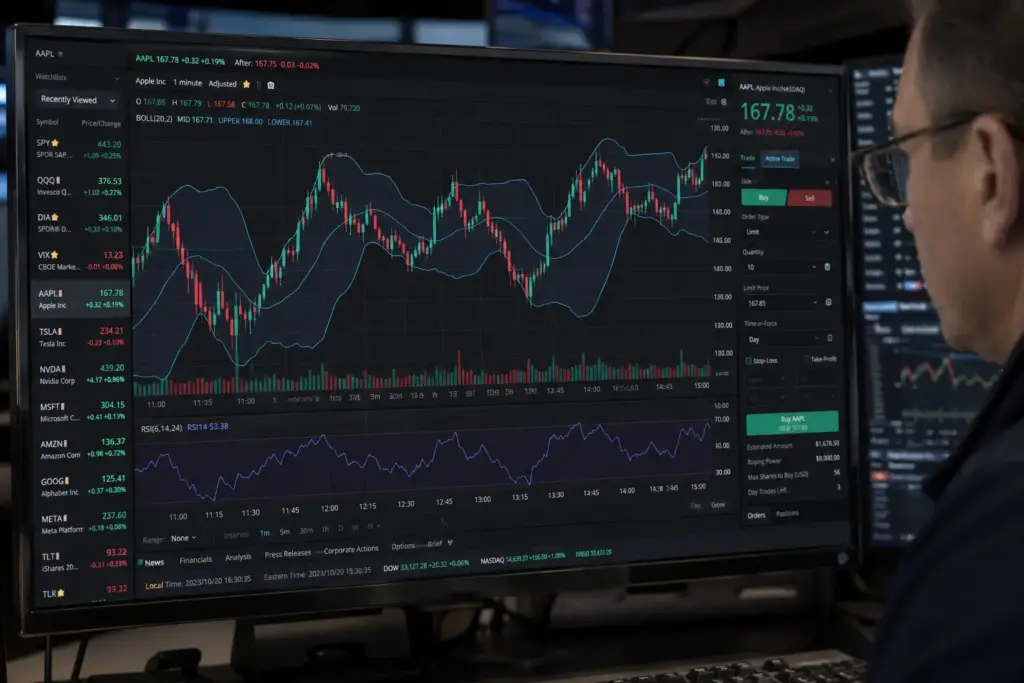
Bollinger Bands
Bollinger Bands plot two standard deviation lines above and below a moving average. When price touches or breaks the upper band, the asset may be overbought. When it touches the lower band, it may be oversold. Mean reversion traders look for price to revert back toward the middle band (the 20-day moving average).
Relative Strength Index (RSI)
RSI measures the speed and magnitude of recent price moves on a scale of 0 to 100. Readings above 70 suggest overbought conditions; readings below 30 suggest oversold conditions. In a mean reversion context, traders watch for RSI to cross back from extreme territory as a confirmation signal before entering a trade.
Moving Average Deviation
This measures how far the current price sits from its moving average — usually expressed as a percentage. A stock trading 10–15% above its 50-day moving average, for example, may be a candidate for mean reversion. Some traders combine this with volume data to add conviction.
Z-Score
Used more by quantitative traders, the Z-score standardises the distance between current price and the mean in terms of standard deviations. A Z-score above +2 or below -2 suggests a significant deviation — and a potential reversion opportunity.
No single indicator should be used alone. The strongest mean reversion setups combine multiple signals — for example, RSI below 30 alongside a price touching the lower Bollinger Band and a bullish candlestick pattern. Traders who also understand derivatives basics can use options strategies alongside mean reversion signals to manage downside risk more effectively.
Trade CFDs with Precision Tools
Apply mean reversion strategies across global markets using leveraged CFDs
What Markets Work Best for Mean Reversion?
Mean reversion performs best in range-bound markets and with liquid, well-established assets.
Equities (Stocks & ETFs)
Individual stocks — particularly blue-chip or large-cap stocks — exhibit strong mean reversion tendencies, especially after earnings-driven spikes or macro-driven sell-offs. US stocks, ETFs, and ADRs are among the most liquid and data-rich environments for applying this strategy. ETFs are particularly well-suited because they represent diversified baskets of assets, reducing the chance of a permanent fundamental shift distorting the mean.
Forex (Currency Pairs)
Currency pairs often revert to mean after sharp, news-driven moves — particularly major pairs like EUR/USD or USD/JPY. Because forex basics involve two economies in a constant balance, temporary dislocations are common. Carry trade unwinds, central bank policy surprises, and geopolitical headlines regularly cause short-lived overextensions that mean reversion traders can exploit.
GCC Equities
Regional equity markets — including stocks listed on the Dubai Financial Market and Abu Dhabi Securities Exchange — can also show mean reversion patterns, particularly around dividend cycles or quarterly reporting periods. Traders interested in GCC stocks may find this strategy useful for timing entries in quality regional companies during temporary pullbacks.
What Does NOT Work Well?
Mean reversion fails in strong trending markets. If a stock is in a sustained downtrend due to deteriorating fundamentals (think a company facing an existential business challenge), “buying the dip” expecting a reversion can lead to significant losses. This is why risk management and combining mean reversion signals with fundamental analysis is essential — you want to trade the reversion in an asset that still has strong underlying value.
Access Global & GCC Equities
From CFDs to futures and global equities — all in one place.
What Are the Key Risks of Mean Reversion Trading?
The biggest danger is confusing a temporary overextension with a fundamental change in direction.
Mean reversion is powerful, but it is not a guarantee. Here are the main risks traders must manage:
- Catching a falling knife. Just because a price has dropped 20% does not mean it will stop there. If the selloff is driven by a genuine deterioration in the asset’s value, the mean itself may shift lower over time — and your “reversion” trade keeps losing.
- Timing risk. Even when the reversion eventually happens, markets can stay irrational far longer than a trader’s capital can hold a position. Stop-losses and position sizing are non-negotiable.
- Regime changes. Mean reversion works in sideways or oscillating markets. When a market shifts into a strong trend, the same signals that previously worked can produce a string of losing trades. Traders need to assess the broader market regime before deploying a mean reversion approach.
- Leverage amplification. For traders using CFDs or futures and options, leverage magnifies both gains and losses. A mean reversion trade that moves further against you before snapping back can wipe out a leveraged position before the expected reversion occurs.
The solution is disciplined risk management: pre-defined stop-loss levels, appropriate position sizing, and never risking more on a single mean reversion trade than you can afford to lose.
Trade with a Regulated, Award-Winning Broker
PhillipCapital DIFC is regulated by the DFSA — FOW Best Non-Bank Broker 2024.

Conclusion & Key Takeaways
Mean reversion is one of the most logical and enduring strategies in technical trading. It is grounded in a simple idea — that extreme price moves are temporary — and supported by decades of market data across virtually every asset class.
For traders who take the time to understand the tools, identify the right market conditions, and manage risk carefully, mean reversion offers a structured, repeatable framework for finding high-probability entries and exits.
Key Takeaways:
- Mean reversion is the tendency of an asset’s price to return toward its historical average after an extreme move.
- Key indicators include Bollinger Bands, RSI, moving average deviation, and the Z-score.
- It works best in liquid, range-bound markets — stocks, forex, and ETFs are ideal candidates.
- It carries real risk: leverage, timing, and regime changes can turn a “sure reversion” into a significant loss.
- Always combine mean reversion signals with risk management rules and, where possible, a fundamental view on the asset’s underlying value.
- Pairing this strategy with a reliable broker offering global market access, real-time data, and multi-asset execution is essential for consistent results.
Whether you are an active day trader, a swing trader, or a longer-term investor looking for smarter entry points, mean reversion deserves a place in your analytical toolkit.
Frequently Asked Questions (FAQs)
Does mean reversion actually work in real trading?
Yes — but only in the right conditions. It works well in stable, liquid markets where no major fundamental shift is driving the price move. It fails when traders mistake a genuine trend change for a temporary deviation. Used with confirmation signals like RSI or Bollinger Bands, it has a solid track record across equities and forex.
What is a simple example of mean reversion in stocks?
A blue-chip stock typically trades near its 50-day moving average. After a broader market sell-off, it drops 12% in three days with no change in its business outlook. A mean reversion trader spots this as an overextension and enters a buy, expecting the price to recover toward its average — which, in stable market conditions, it often does within one to two weeks.
Is mean reversion the same as "buying the dip"?
They are related but not identical. Buying the dip is a general idea — buying after any price drop. Mean reversion is more disciplined: it uses statistical tools to measure how far a price has deviated from its average before entering. Not every dip qualifies — mean reversion requires evidence of an overextension, not just a lower price.
Which timeframe works best for mean reversion trading?
There is no single best timeframe — it depends on your trading style. Day traders use 5–15 minute charts and target quick intraday snaps back to VWAP or a short-term moving average. Swing traders prefer the daily chart, targeting a return to the 20- or 50-day moving average over several days. Both work; consistency in applying the rules matters more than the timeframe itself.
Disclaimer:
Trading foreign exchange and/or contracts for difference on margin carries a high level of risk, and may not be suitable for all investors as you could sustain losses in excess of deposits. The products are intended for retail, professional and eligible counterparty clients. Before deciding to trade any products offered by PhillipCapital (DIFC) Private Limited you should carefully consider your objectives, financial situation, needs and level of experience. You should be aware of all the risks associated with trading on margin. The content of the Website must not be construed as personal advice. For retail, professional and eligible counterparty clients. Before deciding to trade any products offered by PhillipCapital (DIFC) Private Limited you should carefully consider your objectives, financial situation, needs and level of experience. You should be aware of all the risks associated with trading on margin.
Rolling Spot Contracts and CFDs are complex instruments and come with a high risk of losing money rapidly due to leverage. 78% of our retail client accounts lose money while trading with us. You should consider whether you understand how Rolling Spot Contracts and CFDs work, and whether you can afford to take the high risk of losing your money.
Moving Average Crossover
Moving Average Crossover Introduction Every trader, whether new or experienced,...
Read More
Support-Resistance Bounce
Support/Resistance Bounce Table of Contents Introduction What Is Support and...
Read More
Breakout Trading
Breakout Trading Introduction Every experienced trader knows that markets don’t...
Read More
Trend Following Strategy
Trend Following Strategy Introduction Most traders spend years trying to...
Read More
Magic Formula (Greenblatt’s Strategy)
Magic Formula Investing A Guide to Greenblatt’s Systematic Strategy Introduction...
Read More
Rebalancing Strategy
Rebalancing Strategy Mastering Portfolio Rebalancing: A Strategic Approach to Risk...
Read More
Contrarian Investing /Dip Buying
Contrarian Investing / Dip buying Mastering the Art of Contrarian...
Read More
Growth at Reasonable Price (GARP)
Growth at Reasonable Price (GARP) Mastering Growth at Reasonable Price...
Read More
Sector Rotation Strategy
Sector Rotation A Strategic Guide to Investing Through Economic Cycles...
Read More
Dividend Growth Investing
Dividend Growth Investing Mastering Dividend Growth Investing: The Strategy for...
Read More
Growth Investing
Growth Investing The High-Risk, High-Reward Strategy for UAE Investors Growth...
Read More

Buy and Hold vs. Active Trading
Buy and Hold vs. Trading Understanding the difference in mindset...
Read More