
Bollinger Bands Strategy Introduction Every trader, at some point, asks...
Read MoreSupport/Resistance Bounce
Table of Contents
Introduction
Every price chart tells a story — and at the heart of that story are price levels where the market repeatedly pauses, reverses, or accelerates. These are support and resistance levels, and the strategy of trading a bounce off these levels is one of the most widely used approaches in technical analysis.
Whether you trade global equities, forex pairs, or commodities, understanding how prices behave at these key zones can sharpen your timing, improve your entries, and reduce costly guesswork. This guide breaks down the support/resistance bounce strategy in plain language — explaining what it is, why it works, and how to apply it with discipline.
What Is Support and Resistance in Trading?
Support is a price level where a falling asset tends to pause or reverse upward. Think of it as a floor — buyers step in at this price, creating enough demand to stop further decline.
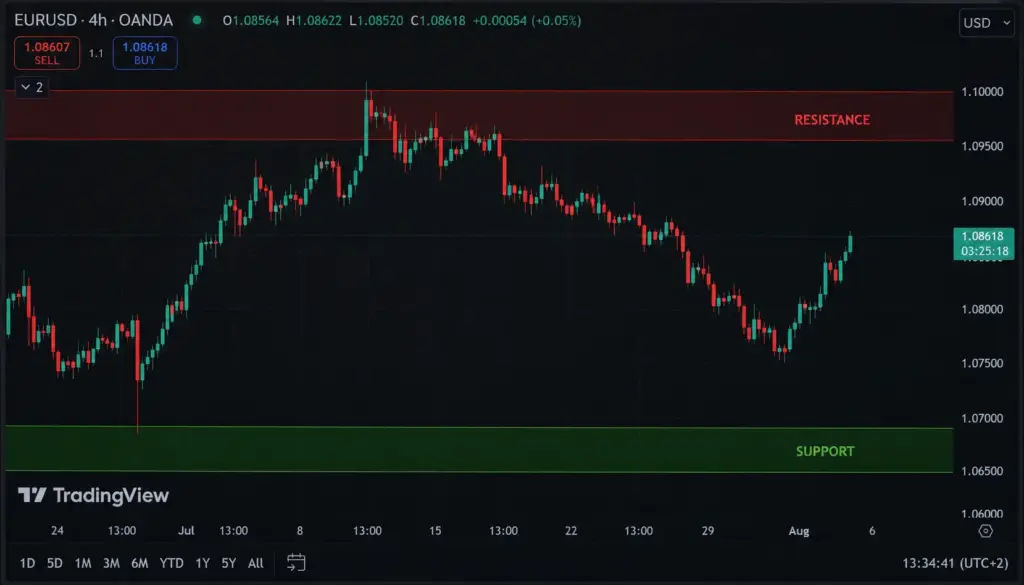
Resistance is the opposite: a price ceiling where a rising asset tends to stall or pull back. At resistance, sellers become more active, outweighing buying pressure and capping the advance.
These levels are not random. They form because of market memory — traders remember where prices reversed in the past and expect similar behavior in the future. Over time, this collective expectation becomes self-reinforcing. The more times a level holds, the more significant and reliable it becomes.
Support and resistance levels appear across all asset classes and all timeframes — from a 5-minute forex chart to a monthly equities chart. They are the foundational building blocks of technical chart analysis and are used by retail traders, institutional desks, and algorithmic systems alike
What Is a Support/Resistance Bounce?
A support/resistance bounce is a trading strategy that seeks to profit from predictable price reversals at established support or resistance levels.
In a support bounce, the price falls toward a known support zone, shows signs of slowing down (often with a reversal candlestick pattern), and then moves back upward. A trader enters a long (buy) position anticipating this upward reversal.
In a resistance bounce, the price rises toward a known resistance zone, loses momentum, and turns lower. A trader enters a short (sell) position expecting the price to retreat.
The logic is straightforward: if a price level has held multiple times in the past, there is a reasonable probability it will hold again. The bounce strategy is built on this probability — not certainty, but repeatable, testable behavior.
This approach is particularly popular among traders who deal in CFDs and Spot FX, where short-term price swings offer frequent opportunities to apply bounce setups across currency pairs, indices, and commodities.
Why Do Prices Bounce at These Levels?
Understanding the why behind a bounce makes you a more confident trader — and less likely to abandon a setup at the first sign of volatility.
- Psychological Price Memory Markets are driven by human decisions. When a price level has previously caused a significant reversal, traders remember it. Buyers who missed the last bounce are ready to buy again. Sellers who lost at resistance will sell again. This collective behavior creates a self-fulfilling dynamic at key levels.
- Institutional Order Placement Large institutional participants — banks, funds, and asset managers — often place limit orders at historically significant price levels. When price reaches those zones, these large orders absorb selling (at support) or buying (at resistance), creating the bounce. Traders accessing global equity markets or futures markets will often see this effect most clearly around round numbers and multi-month highs and lows.
- Stop-Loss Clustering Many retail traders set stop-losses just below support or just above resistance. When price approaches these zones, the density of stop orders influences how the market reacts — often sharply, generating the bounce move that technical traders anticipate.
- Role Reversal Principle In technical analysis, a broken support level often becomes resistance, and a broken resistance level often becomes support. This “flip” creates fresh bounce opportunities when price returns to test the broken level from the other side.
How to Identify a Valid Bounce Setup on a Chart
Not every touch of a support or resistance level produces a clean bounce. Here’s how to assess whether a setup has genuine quality:
Look for Multiple Touches
A level that has been tested and held two or more times is far more significant than one that has only been touched once. The more tests a level has survived, the more institutional weight it carries.
Confirm on a Higher Timeframe
A support level visible on a weekly chart carries much more weight than one drawn on a 15-minute chart. Always check whether your setup aligns with higher timeframe structure — this dramatically improves the odds of a clean bounce.
Watch for Reversal Candlestick Signals
When price reaches a support or resistance zone, look for confirming candlestick patterns such as a pin bar (long wick rejecting the level), an engulfing candle, or a doji with follow-through. These patterns signal that the market has tested the level and rejected it — the core ingredient of a bounce trade.
Assess the Approach — Gradual vs. Sharp
A price that gradually drifts into support after a controlled pullback is more likely to bounce cleanly than one arriving after a near-vertical, panic-driven drop. The manner in which price arrives at the level matters.
Use Volume as a Filter
At genuine support levels, you often see a spike in volume as buyers step in. Declining volume on the approach to resistance followed by a surge on rejection can also validate the setup. Traders using futures and options often monitor volume closely alongside price action to confirm these setups.
Trade CFDs Across Global Markets
Apply support/resistance bounce strategies on real instruments — forex, indices, and commodities.
How Do You Enter and Exit a Bounce Trade?
Execution matters as much as analysis. Here is a disciplined approach to entering and exiting a bounce trade:
Entry Timing: Wait for Confirmation
The most common mistake is entering the moment price touches a support or resistance level. Instead, wait for a closing candle that confirms rejection. A bullish pin bar closing above support, or a bearish engulfing candle closing below resistance, provides the confirmation most professional traders require before committing capital.
Setting Your Stop-Loss
For a support bounce, place your stop-loss a few points below the support level — not right at it. The level may be briefly violated before the bounce occurs (a common trap for tight stops). Give the trade room to breathe. For a resistance bounce (short trade), place the stop above the resistance zone.
Defining Your Target
A common and sensible approach is to target the next meaningful resistance level (for a support bounce) or the next support (for a resistance bounce). A risk-to-reward ratio of at least 1:2 — risking one unit to gain two — is a sound standard to apply consistently.
Position Sizing
Never risk more than a small, predetermined percentage of your account on any single trade. This discipline is what separates traders who survive and improve from those who blow up on a single bad setup. Whether you are trading US stocks and ETFs or GCC equities, consistent position sizing is non-negotiable.
What Are the Risks and How Do You Manage Them?
The bounce strategy is not infallible. Here’s what can go wrong — and how to stay protected:
False Bounces (Bull/Bear Traps) Price may appear to bounce at support, luring in buyers, only to reverse sharply and break through. This is called a bull trap at support or a bear trap at resistance. Using confirmation candles and waiting for a close — rather than reacting to intraday wicks — significantly reduces the risk of being caught in these traps.
Level Degradation Support and resistance levels weaken with each successive test. A level tested four or five times in a short period may eventually break rather than hold. Be alert to the quality and freshness of the level you are trading.
Ignoring the Broader Trend Trading a support bounce against a powerful downtrend carries far greater risk than trading with the trend. Always factor in the overall market direction. A bounce strategy works best when aligned with — not fighting against — the dominant trend.
Over-Leveraging Bounce trades can be tight and precise, which tempts traders to use high leverage to amplify small moves. This significantly increases the risk of liquidation on a brief adverse move. Particularly for those trading leveraged CFD products, managing leverage is a critical discipline.
Trade Across Multiple Asset Classes
From global equities to forex and futures — execute your strategies on reliable infrastructure.

Conclusion & Key Takeaways
The support/resistance bounce is not just a chart pattern — it is a window into how market participants collectively behave at meaningful price zones. When applied with discipline, proper confirmation, and sound risk management, it becomes one of the more reliable and repeatable strategies available to both new and experienced traders.
Key Takeaways:
- Support acts as a price floor; resistance acts as a price ceiling. Both reflect collective market memory.
- A valid bounce setup requires multiple prior touches, a confirmation candle, and ideally alignment with a higher timeframe level.
- Always wait for a confirmed close before entering — never jump on the first touch of a level.
- Use a clearly defined stop-loss below support or above resistance and target a risk-to-reward ratio of at least 1:2.
- Understand that false breakouts exist — confirmation signals reduce, but do not eliminate, this risk.
- Bounce trades work best with the trend, not against it.
- Consistent position sizing and leverage management are what turn a good strategy into sustainable trading performance.
Mastering support and resistance takes screen time and practice, but the principles are timeless — and they apply whether you are charting a forex pair, a GCC stock, or a global equity index.
Frequently Asked Questions (FAQs)
How many times should a level be tested before I trust it as support or resistance?
Most traders look for at least two clear touches before treating a level as reliable. A third test adds even more confidence. The key is that each touch should show a meaningful reaction — not just a brief pause. A level that has been respected across different timeframes (e.g., visible on both the daily and weekly chart) carries significantly more weight than one that only appears on a short-term chart.
How do I know if the price will bounce or break through the level?
There’s no guaranteed way to know in advance — which is exactly why you wait for confirmation. Signs that a bounce is more likely: the price arrives gradually (not in a sharp panic drop), volume is relatively low on approach, and a reversal candle forms at the level. Signs a breakout may be coming: repeated tests in a short time, strong trending momentum, or a wide-range candle closing decisively beyond the level.
Where should I put my stop-loss on a bounce trade?
Place your stop beyond the level, not right at it. For a support bounce, put the stop a few points below support — not at it. Price often dips slightly through a level before reversing (a “wick” or fake-out), and stops placed too tightly get hit before the actual bounce plays out. Give the trade enough room to breathe while still keeping the risk amount within your pre-planned limit.
Does the support/resistance bounce strategy work in all market conditions?
It works best in range-bound or mildly trending markets where price repeatedly moves between defined levels. In a strong, fast-moving trend, levels break more frequently, making bounce setups riskier. During major news events or high-volatility periods, even well-established levels can give way. Always check the broader market context before entering a bounce trade — the strategy is a tool, not a guarantee.
Disclaimer:
Trading foreign exchange and/or contracts for difference on margin carries a high level of risk, and may not be suitable for all investors as you could sustain losses in excess of deposits. The products are intended for retail, professional and eligible counterparty clients. Before deciding to trade any products offered by PhillipCapital (DIFC) Private Limited you should carefully consider your objectives, financial situation, needs and level of experience. You should be aware of all the risks associated with trading on margin. The content of the Website must not be construed as personal advice. For retail, professional and eligible counterparty clients. Before deciding to trade any products offered by PhillipCapital (DIFC) Private Limited you should carefully consider your objectives, financial situation, needs and level of experience. You should be aware of all the risks associated with trading on margin.
Rolling Spot Contracts and CFDs are complex instruments and come with a high risk of losing money rapidly due to leverage. 78% of our retail client accounts lose money while trading with us. You should consider whether you understand how Rolling Spot Contracts and CFDs work, and whether you can afford to take the high risk of losing your money.
Moving Average Crossover
Moving Average Crossover Introduction Every trader, whether new or experienced,...
Read More
Support-Resistance Bounce
Support/Resistance Bounce Table of Contents Introduction What Is Support and...
Read More
Breakout Trading
Breakout Trading Introduction Every experienced trader knows that markets don’t...
Read More
Trend Following Strategy
Trend Following Strategy Introduction Most traders spend years trying to...
Read More
Magic Formula (Greenblatt’s Strategy)
Magic Formula Investing A Guide to Greenblatt’s Systematic Strategy Introduction...
Read More
Rebalancing Strategy
Rebalancing Strategy Mastering Portfolio Rebalancing: A Strategic Approach to Risk...
Read More
Contrarian Investing /Dip Buying
Contrarian Investing / Dip buying Mastering the Art of Contrarian...
Read More
Growth at Reasonable Price (GARP)
Growth at Reasonable Price (GARP) Mastering Growth at Reasonable Price...
Read More
Sector Rotation Strategy
Sector Rotation A Strategic Guide to Investing Through Economic Cycles...
Read More
Dividend Growth Investing
Dividend Growth Investing Mastering Dividend Growth Investing: The Strategy for...
Read More
Growth Investing
Growth Investing The High-Risk, High-Reward Strategy for UAE Investors Growth...
Read More

Buy and Hold vs. Active Trading
Buy and Hold vs. Trading Understanding the difference in mindset...
Read More