

Bollinger Bands Strategy Introduction Every trader, at some point, asks...
Read MoreBollinger Bands Strategy
Introduction
Every trader, at some point, asks the same question: Is the market about to move — or is it just noise? Bollinger Bands were created to answer exactly that. Developed by John Bollinger in the early 1980s, this tool is now one of the most widely used technical indicators across stocks, forex, commodities, and CFDs worldwide.
Whether you are just building your knowledge of trading strategies or looking to sharpen an existing approach, understanding Bollinger Bands can genuinely change how you read a chart. This guide breaks down what they are, how they work, and how to use them practically — without the unnecessary complexity.
What Are Bollinger Bands?
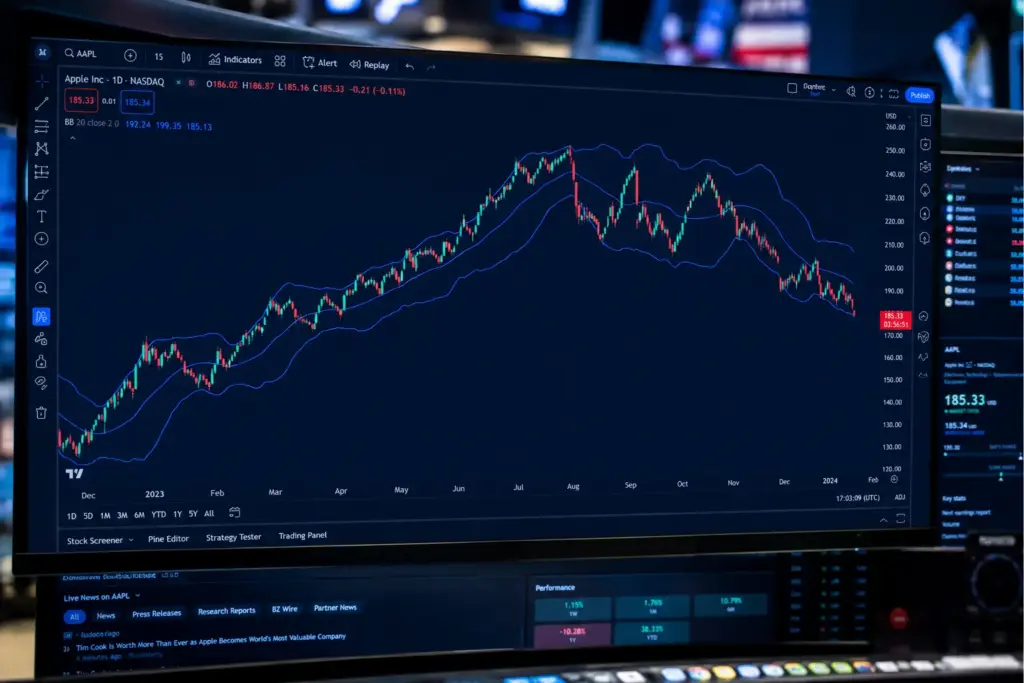
Bollinger Bands are a volatility-based technical indicator displayed directly on a price chart. They consist of three lines that move dynamically with the market: a middle line (which is a moving average of recent prices), an upper band placed above it, and a lower band placed below it. The gap between the upper and lower bands is not fixed — it expands and contracts based on how volatile the market is at any given time.
The genius of the tool is in that expansion and contraction. When markets are calm and prices are moving in a tight range, the bands narrow into what traders call a “squeeze.” When markets become volatile and prices start moving sharply, the bands widen. This dynamic behaviour gives traders a visual read on market conditions that a plain price chart alone cannot provide.
Unlike fixed support and resistance lines, Bollinger Bands adapt to current market conditions in real time — which is why they remain relevant across different asset classes and time horizons, from intraday trading to weekly swing trades.
How Are They Built?
Understanding the construction helps you use the tool more confidently. The three components are:
Middle Band — A Simple Moving Average (SMA) of closing prices. Default: 20-period SMA.
Upper Band — The middle band plus 2 standard deviations. Default: +2 SD.
Lower Band — The middle band minus 2 standard deviations. Default: –2 SD.
Standard deviation is a measure of how spread out prices are from their average. When prices are moving a lot (high volatility), the standard deviation is large and the bands widen. When prices are stable (low volatility), the standard deviation is small and the bands tighten.
The default setting of 20 periods and 2 standard deviations was chosen by Bollinger himself after extensive testing. At this setting, statistically around 95% of price action tends to occur within the bands — which makes a close outside them a notable event worth paying attention to.
What Do Bollinger Bands Actually Tell You?
Volatility Measurement
The primary role of Bollinger Bands is to measure market volatility in real time. A wide band signals a high-volatility environment — prices are moving aggressively. A narrow band signals low volatility — the market is in consolidation mode. Traders pay close attention to transitions between these two states, because a period of low volatility often precedes a sharp price move in either direction.
Relative Price Levels
The bands also define what is “relatively high” and “relatively low” for a given asset at a given time. A price touching the upper band does not automatically mean “sell” — but it signals that the price is at the high end of its recent range. Similarly, touching the lower band indicates the price is at the low end. Context — such as overall trend direction and volume — always matters when interpreting these levels.
Important: Bollinger Bands do not predict the future direction of prices. They describe the current market environment. Combining them with trend or momentum indicators significantly improves their effectiveness.
What Are the Key Trading Signals?
The Bollinger Band Squeeze
This is arguably the most powerful signal the indicator produces. When the bands compress tightly together, it signals that the market has entered a low-volatility consolidation phase. Historically, these quiet periods tend to be followed by significant breakouts. The squeeze itself does not tell you which direction the breakout will go — but it alerts you that a large move may be coming. Traders often combine this signal with volume analysis or momentum indicators to anticipate the direction before committing to a trade.
The Breakout Signal
Once prices close decisively above the upper band or below the lower band after a squeeze, many traders interpret this as confirmation that a new trend is starting. A close above the upper band may signal the beginning of an upward move; a close below the lower band may signal the start of a downward trend. It is important to wait for confirmation rather than assuming a single candle is enough — false breakouts are common, especially in choppy markets.
Mean Reversion Trading
In range-bound, sideways markets, prices tend to oscillate between the upper and lower bands without breaking out significantly. In these conditions, traders use a mean reversion approach: when price touches or exceeds the upper band, they look for potential selling opportunities; when price drops below the lower band, they look for potential buying opportunities — on the assumption that prices will revert back toward the middle band. This works well in stable, non-trending markets but can be dangerous when a strong trend is in place.
“Walking the Bands”
During strong trending markets, prices can “walk” along the upper or lower band for extended periods — meaning they repeatedly close near or above the upper band in an uptrend, or near or below the lower band in a downtrend. This signals strength, not overbought conditions. Attempting to fade a trend simply because prices are at the upper band in a strong bull market is a common and costly mistake.
Ready to Apply These Strategies in Live Markets?
Trade global stocks, CFDs, and forex with a DFSA-regulated broker trusted since 1975.

Which Markets Can You Apply Bollinger Bands To?
Bollinger Bands are versatile enough to be applied across virtually every traded market. Here is how they perform across different asset classes:
| Market | Bollinger Bands Effectiveness | Best Use Case |
|---|---|---|
| Stocks & ETFs | High | Identifying breakouts and trend confirmation |
| Forex / Spot FX | High | Volatility timing and range-bound trading |
| CFDs | High | Short-term momentum and squeeze setups |
| Futures | Moderate–High | Trend-following and position sizing |
| Commodities | Moderate | Volatility spikes during news events |
For investors accessing CFD and Spot FX markets, Bollinger Bands are especially practical because these markets move fast and volatility signals are critical for timing entries and exits. Similarly, traders working with futures and options can use the bands to assess whether the market is in a breakout or consolidation phase before placing directional trades.
What Indicators Work Well With Bollinger Bands?
Bollinger Bands are best used in combination with other tools rather than in isolation. Here are three strong pairings:
RSI (Relative Strength Index)
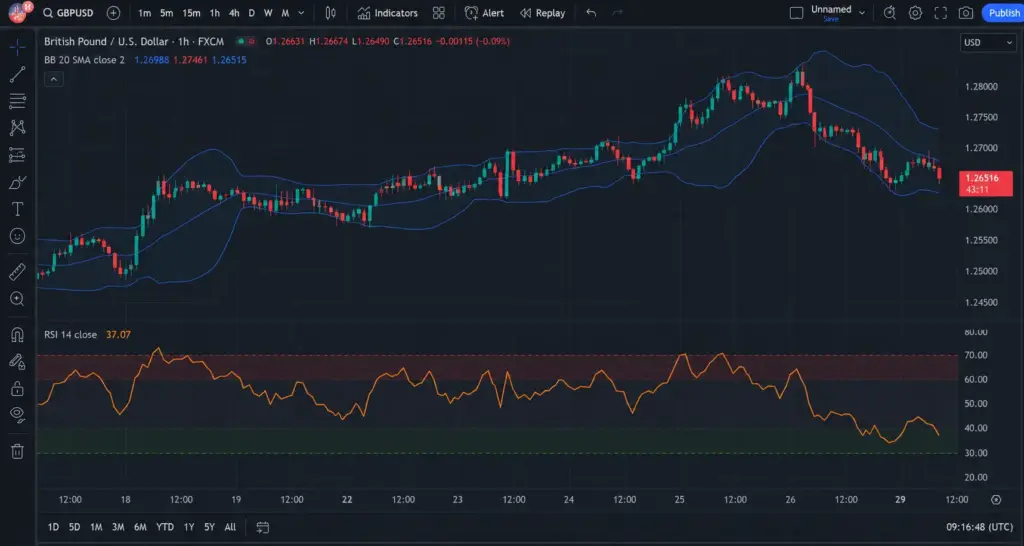
RSI measures whether an asset is overbought or oversold on a scale from 0 to 100. When a price touches the lower Bollinger Band and the RSI simultaneously shows an oversold reading (below 30), it provides stronger confirmation of a potential buying opportunity than either indicator alone. The reverse applies at the upper band with an overbought RSI reading (above 70).
MACD (Moving Average Convergence Divergence)
MACD tracks momentum and trend direction. When Bollinger Bands signal a potential breakout from a squeeze, the MACD can confirm whether momentum is building in the expected direction. A MACD crossover aligning with the breakout direction significantly increases the reliability of the signal.
Volume
Volume is arguably the most important confirmation tool. A breakout from a Bollinger Band squeeze accompanied by above-average volume is far more trustworthy than a low-volume breakout. Many false breakouts occur on thin volume — high volume validates that the move has real conviction behind it.
Traders who want to deepen their understanding of how technical signals fit alongside company and macroeconomic fundamentals can explore fundamental analysis as a complementary layer to their technical approach.
Refine Your Trading Strategy
Get expert insights and advanced tools
What Mistakes Should Traders Avoid?
Treating the Bands as Hard Buy/Sell Rules
The most common mistake is using the upper band as an automatic sell signal and the lower band as an automatic buy signal. This only works in ranging markets. In a strong trend, fading the move at every band touch will result in consistent losses. Always identify the market regime first — trending or ranging — before deciding how to interpret the signals.
Ignoring the Middle Band
The 20-period moving average in the centre is not just a reference line — it is a dynamic support and resistance level in its own right. During uptrends, pullbacks to the middle band often represent buying opportunities. During downtrends, rallies to the middle band often represent selling opportunities. Many traders neglect this and focus only on the outer bands.
Using Bollinger Bands on Very Short Timeframes Without a Filter
On very short timeframes, the bands generate a lot of noise and false signals. Traders using these timeframes should apply additional filters — such as requiring the signal to align with the trend on a higher timeframe — before acting. This is especially important for those trading leveraged CFDs, where whipsaw moves can amplify losses quickly.
Overlooking Squeeze Direction and Confirmation
Not every squeeze leads to an explosive breakout. Sometimes prices drift out of a squeeze gradually rather than explosively. Waiting for a decisive closing candle outside the band — rather than trading on the first touch — helps filter out many false setups. Those interested in how similar discipline of patience and confirmation applies in longer-term investing may benefit from reading about the portfolio rebalancing strategy, where process matters as much as timing.
Conclusion
Bollinger Bands have stood the test of time for a simple reason: they translate complex market behaviour — volatility, momentum, and relative price positioning — into a clean, visual framework that traders of all experience levels can understand and act on.
They work across markets, timeframes, and trading styles. Whether you are a swing trader watching for squeeze breakouts in global equities or a short-term CFD trader using mean reversion setups in forex pairs, Bollinger Bands can be a valuable part of your toolkit. The key is to use them as one input in a broader decision-making process — not as a standalone system.
Those building a broader trading foundation should also explore resources on stock market basics and forex basics available in the PhillipCapital DIFC learning centre.
Key Takeaways
- Bollinger Bands consist of a middle SMA and upper/lower bands set at 2 standard deviations — they expand in volatile markets and tighten when markets are calm.
- The Bollinger Band Squeeze is the most powerful signal — a period of low volatility that frequently precedes a significant directional breakout.
- In trending markets, prices can “walk the bands” — do not mistake sustained upper-band closes as automatic sell signals.
- Mean reversion trading using the bands works best in clearly range-bound, sideways markets.
- Always combine Bollinger Bands with confirmation tools such as RSI, MACD, or volume for higher-probability setups.
- The middle band (20-period SMA) is a critical dynamic level — treat it as active support or resistance, not just a midpoint.
- Avoid mechanical trading rules; context, market regime, and signal confluence always matter.
Put Your Knowledge Into Practice
Access global stocks, CFDs, futures, and more with a DFSA-regulated broker.
Frequently Asked Questions (FAQs)
Do Bollinger Bands work for beginners?
Yes — and they are actually one of the better starting points in technical analysis. The visual nature of the bands makes it easy to grasp market conditions at a glance without needing advanced knowledge. A beginner can start by simply observing how price behaves when it touches the upper or lower band, and build from there. That said, no indicator works reliably on its own. Pairing Bollinger Bands with one simple confirmation tool — such as RSI — makes the approach far more effective even at an early stage.
What is the best Bollinger Bands setting for day trading?
The default 20-period SMA with 2 standard deviations works well for most timeframes, including day trading. Some short-term traders adjust to a 10-period SMA with 1.5 standard deviations for faster signal response — but this also increases false signals. Rather than chasing the “perfect” setting, most experienced traders keep the defaults and focus on reading the context correctly: is the market trending or ranging? That question matters far more than tweaking numbers.
Can Bollinger Bands predict a breakout?
Not exactly — but they can warn you one may be coming. When the bands squeeze tightly together after a period of normal volatility, it signals that the market is coiling. Breakouts frequently follow these quiet periods. However, the bands alone cannot tell you the direction of the breakout. That is why traders use volume, MACD, or price action patterns to read which way the momentum is likely to push before the move confirms.
What does it mean when price stays outside the Bollinger Band?
It usually signals strong momentum in that direction, not an automatic reversal. This is called “walking the band.” In a powerful uptrend, price can close above the upper band repeatedly for days or weeks — and selling every time would be a losing approach. A close outside the band only becomes a reversal signal when it is followed by a candle that closes back inside, especially with fading volume. One close outside the band alone is not enough to act on.
Disclaimer:
Trading foreign exchange and/or contracts for difference on margin carries a high level of risk, and may not be suitable for all investors as you could sustain losses in excess of deposits. The products are intended for retail, professional and eligible counterparty clients. Before deciding to trade any products offered by PhillipCapital (DIFC) Private Limited you should carefully consider your objectives, financial situation, needs and level of experience. You should be aware of all the risks associated with trading on margin. The content of the Website must not be construed as personal advice. For retail, professional and eligible counterparty clients. Before deciding to trade any products offered by PhillipCapital (DIFC) Private Limited you should carefully consider your objectives, financial situation, needs and level of experience. You should be aware of all the risks associated with trading on margin.
Rolling Spot Contracts and CFDs are complex instruments and come with a high risk of losing money rapidly due to leverage. 78% of our retail client accounts lose money while trading with us. You should consider whether you understand how Rolling Spot Contracts and CFDs work, and whether you can afford to take the high risk of losing your money.
Moving Average Crossover
Moving Average Crossover Introduction Every trader, whether new or experienced,...
Read More
Support-Resistance Bounce
Support/Resistance Bounce Table of Contents Introduction What Is Support and...
Read More
Breakout Trading
Breakout Trading Introduction Every experienced trader knows that markets don’t...
Read More


Trend Following Strategy
Trend Following Strategy Introduction Most traders spend years trying to...
Read More

Magic Formula (Greenblatt’s Strategy)
Magic Formula Investing A Guide to Greenblatt’s Systematic Strategy Introduction...
Read More
Rebalancing Strategy
Rebalancing Strategy Mastering Portfolio Rebalancing: A Strategic Approach to Risk...
Read More
Contrarian Investing /Dip Buying
Contrarian Investing / Dip buying Mastering the Art of Contrarian...
Read More
Growth at Reasonable Price (GARP)
Growth at Reasonable Price (GARP) Mastering Growth at Reasonable Price...
Read More
Sector Rotation Strategy
Sector Rotation A Strategic Guide to Investing Through Economic Cycles...
Read More
Dividend Growth Investing
Dividend Growth Investing Mastering Dividend Growth Investing: The Strategy for...
Read More
Growth Investing
Growth Investing The High-Risk, High-Reward Strategy for UAE Investors Growth...
Read More

Buy and Hold vs. Active Trading
Buy and Hold vs. Trading Understanding the difference in mindset...
Read More