Dividend Payout Ratio Explained

Dividend Payout Ratio Explained: How to Judge Whether a Dividend Is Sustainable

A company can announce a generous dividend and still struggle to pay it a few years later. The dividend payout ratio is one of the quickest ways to see how much of a company’s profit is being handed to shareholders and how much is being kept for the business. Read well, it helps investors tell a steady income stock from one that may be stretching.

This guide explains the ratio from first principles. You will learn the formula, how to read the result, how it differs from related measures such as free cash flow payout and dividend yield, why it behaves differently across US, GCC and global stocks, and which warning signs deserve a closer look.

What Is a Dividend Payout Ratio?

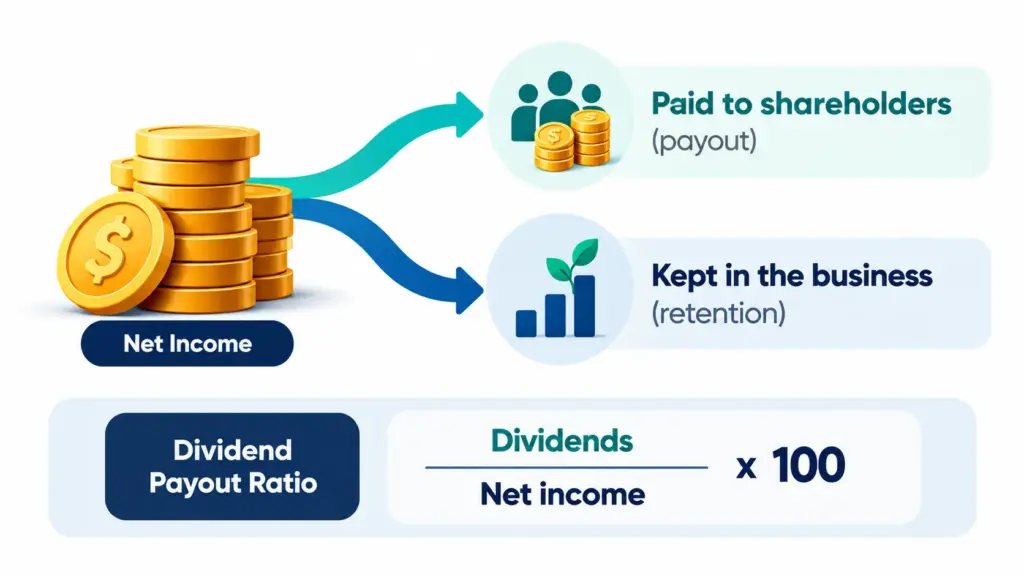
The dividend payout ratio is the percentage of a company’s profit that it pays to shareholders as dividends. A dividend is a cash payment a company makes to its owners from earnings. If a company earns 100 and distributes 40, its payout ratio is 40%, and the remaining 60% is retained to fund the business.

The portion a company keeps is called the retention ratio. The two always add up to 100%, so a 40% payout ratio means a 60% retention ratio. This split reveals a company’s priorities. A business that retains most of its profit is usually funding expansion, paying down debt or building a cushion. A business that pays out most of it is signalling maturity and confidence in steady earnings, but it leaves less room for error.

Investors use the ratio to answer two practical questions. First, can the company keep paying the dividend if profits dip? Second, is there room to raise the dividend over time? A low ratio usually leaves more headroom on both counts, while a very high ratio leaves little.

Financial analyst reviewing dividend and earnings data on a monitor in a modern Dubai office.

How Do You Calculate the Dividend Payout Ratio?

Divide the dividends paid by the net income, then multiply by 100. On a per-share basis, divide dividends per share by earnings per share. Both versions give the same answer when the share count is stable, so investors can use whichever figures are easier to find.

Earnings per share, or EPS, is a company’s profit divided by its number of shares. Dividends per share, or DPS, is the total dividend divided by the same share count. Annual reports, exchange filings and most brokerage platforms show both figures.

The two formulas

  • Total basis: Payout ratio = (Total dividends paid / Net income) x 100.
  • Per-share basis: Payout ratio = (Dividends per share / Earnings per share) x 100.

A worked example

The three companies below are hypothetical and are used only to show how the arithmetic works.

Company EPS DPS Payout Ratio Retention Ratio What It Suggests
Company A4.002.0050%50%Half of profit is paid out and half is kept, which leaves a balanced buffer.
Company B2.002.40120%NegativeThe dividend exceeds profit, so it is being funded from reserves, cash or borrowing.
Company C5.001.0020%80%A small share is paid out, leaving ample room to raise the dividend.

Company B deserves attention. A payout above 100% can happen for a year when profit falls temporarily, but it cannot continue indefinitely without cash from somewhere else.

The ratio can also be misleading when earnings are negative or unusually small. In those cases the result may look extreme or meaningless, and investors usually look at cash flow instead, which the next sections cover.

Which profit number should be used?

Most investors start with net income or diluted EPS, meaning EPS after allowing for shares that could be created from options or convertible securities. Some prefer adjusted earnings that strip out one-off gains or charges. Whichever figure is chosen, using the same basis when comparing companies keeps the comparison fair. For a deeper look at reading profit figures, the fundamental analysis resources from PhillipCapital DIFC explain how income statements are structured.

Turn dividend knowledge into a global equity portfolio

Explore US stocks, ETFs and ADRs through a DFSA-regulated broker based in Dubai.

What Is a Good Dividend Payout Ratio?

There is no single good number. A moderate ratio can suggest a balance between rewarding shareholders and reinvesting, but what counts as healthy depends heavily on the industry, the stability of earnings and the company’s stage of growth.

Think of the ratio as a question rather than a score. The real question is whether the company can keep paying this dividend through a weaker year. Steady businesses with predictable revenue can often sustain higher payouts, because their profits rarely swing. Businesses whose earnings rise and fall with commodity prices, consumer cycles or interest rates generally need a lower ratio to survive the bad years.

It also helps to separate three zones in broad terms:

  • A low payout ratio indicates the company retains most of its earnings, which can signal room to grow the dividend or a focus on reinvestment.
  • A moderate payout ratio indicates a balance between income for shareholders and money kept for growth and resilience.
  • A very high or above-100% payout ratio indicates the dividend may be under strain and warrants checking cash flow, debt and the outlook for earnings.

Some sectors structure themselves around distribution. A real estate investment trust, or REIT, is a company that owns income-producing property and is typically set up to distribute most of its income to investors. Judging such a company against a software firm that reinvests heavily would be like comparing a bakery to a laboratory. Always compare a company with its own sector and its own history first.

How Does the Payout Ratio Differ From Free Cash Flow Payout and Dividend Yield?

The earnings payout ratio compares dividends with accounting profit, the free cash flow payout compares them with actual cash generated, and dividend yield compares them with the share price. They answer three different questions, and investors typically use them together rather than relying on one.

Free cash flow is the cash a business has left after paying its operating costs and investing in equipment and facilities. Because dividends are paid in cash rather than in accounting profit, this version often gives a more honest picture of affordability. Net income can be flattered by non-cash items, while cash is harder to dress up.

Dividend yield is different in kind. It tells an investor what income a share pays relative to its current price, not whether the dividend is safe. A falling share price can make yield look attractive precisely because the market doubts the dividend. The dividend yield and stock valuation guides in the PhillipCapital DIFC Learn section cover that measure in more detail.

Comparison: Measures Investors Use to Assess a Dividend

Measure Formula What It Answers Main Limitation
Earnings payout ratioDividends / Net incomeHow much of reported profit goes to shareholdersAccounting profit can include non-cash items or one-off gains
Free cash flow payout ratioDividends / Free cash flowWhether real cash covers the dividendCash flow can swing sharply in years of heavy investment
Dividend yieldAnnual dividend per share / Share priceWhat income the share offers at today’s priceSays nothing on its own about whether the dividend is safe
Retention ratio1 minus payout ratioHow much profit the company keeps to reinvestA high figure is not automatically good if reinvestment is poorly used

A practical habit is to check the earnings payout ratio first, confirm it against the free cash flow payout, and only then look at yield. A company that looks comfortable on both payout measures is in a very different position from one that looks comfortable on earnings but strained on cash.

Why Do Payout Ratios Look Different Across US, GCC and Global Stocks?

Payout ratios differ across markets because dividend culture, reporting calendars, currencies and company policies differ. Some listed companies pay quarterly, others semi-annually or annually, and each firm sets its own policy. Investors should read each company’s own dividend policy and disclosures rather than assuming a market-wide norm.

Several practical differences are worth keeping in mind when comparing companies across borders:

  • Payment frequency varies, so a company paying quarterly and one paying once a year need to be compared on a full-year basis.
  • Currency matters, because dividends are paid in the currency of the listing, and exchange rate movements can change what an investor ultimately receives in their own currency.
  • Reporting standards and calendars differ, which means the profit figure behind the ratio may be calculated on slightly different rules or dates.
  • Withholding tax can apply to dividends from some markets, so the amount received may differ from the declared dividend. Investors should confirm the treatment that applies to them.

PhillipCapital DIFC supports cross-border investing across several of these markets. Investors may consider reviewing US stocks, ETFs and ADRs, GCC stocks and global non-US stocks side by side, applying the same payout checks to each so that comparisons remain consistent.

Invest across GCC and global dividend payers

Open access to GCC and international equities from a single DFSA-regulated brokerage in Dubai.

Which Warning Signs Suggest a Dividend May Be at Risk?

The clearest warning signs are a payout ratio that keeps climbing, dividends that exceed cash flow, rising debt used to fund payments, and shrinking earnings. No single sign is decisive, but several appearing together suggest the dividend may be harder to maintain.

Each signal is worth understanding on its own terms:

  • A payout ratio that rises year after year often means profit is falling while the dividend stays fixed, which compresses the safety margin.
  • A payout above 100% for more than a short period indicates the company is paying out more than it earns and must be using reserves, asset sales or borrowing to do so.
  • Dividends that exceed free cash flow suggest the payment is not being met from the cash the business actually produces.
  • Growing debt alongside a high payout may indicate the company is borrowing to pay shareholders, which is rarely sustainable.
  • An unusually high yield can reflect a share price that has fallen because the market expects a cut.
  • Management language that turns cautious, such as reviewing capital allocation, can foreshadow a change to dividend policy.

A company that cuts or suspends its dividend is not necessarily in terminal trouble. Sometimes a reduced payout lets management protect the balance sheet and invest. The point of watching these signs is to understand the risk before relying on the income, not to predict a cut with certainty.

What Mistakes Do Investors Make With Payout Ratios?

The most common mistake is treating the ratio as a standalone verdict. Others include chasing the highest yield, ignoring the sector, relying on a single year of data and overlooking cash flow. Each of these can make a fragile dividend look safe or a sound one look weak.

The following errors appear repeatedly:

  • Using one year in isolation. A single year can be distorted by a one-off gain or charge, so looking at several years shows the real pattern.
  • Comparing across unlike sectors. A ratio that is normal for a property trust may be alarming for a technology company.
  • Equating a high yield with quality. A high yield may be a symptom of distress rather than a reward.
  • Ignoring cash flow. Profit can look healthy while cash is thin, so the cash-based payout deserves a check.
  • Forgetting that earnings can be negative. When earnings are negative the ratio loses meaning, and other measures are needed.
  • Overlooking the buyback alternative. Some companies return money by repurchasing their own shares rather than paying dividends, which the payout ratio alone does not capture.

Investors who want to place payout analysis within a wider framework can explore the trading and investing strategies covered in the PhillipCapital DIFC Learn section, including dividend-focused approaches.

How Can Investors Put the Payout Ratio to Work Step by Step?

Investors can work through a simple five-step routine: find the dividend and earnings figures, calculate the ratio, check it against cash flow, compare it with sector peers and its own history, and finish by reviewing the debt position. The process takes minutes once the figures are in hand.

Here is the routine in order, using a hypothetical company for illustration:

  1. Gather the figures. Find dividends per share and diluted EPS for the latest full year. Suppose DPS is 1.20 and EPS is 3.00.
  2. Calculate the ratio.20 divided by 3.00 gives 0.40, or a 40% payout ratio, and a 60% retention ratio.
  3. Cross-check with cash. Compare total dividends paid with free cash flow. If cash comfortably covers the dividend, the earnings-based signal is reinforced.
  4. Compare with context. Look at the ratio over the past several years and against similar companies in the same sector. A steady or gently rising pattern reads differently from a sharp jump.
  5. Review the balance sheet. Check whether debt is rising and whether the company can cover its interest costs before concluding that the dividend looks sustainable.

This routine is educational and does not amount to a recommendation about any security. Investors may consider using it as a framework while forming their own view, and should evaluate their own objectives and risk tolerance before making decisions.

Frequently Asked Questions (FAQs)

What is the dividend payout ratio in simple terms?

It is the share of a company’s profit that is paid to shareholders as dividends. For example, if a company earns 100 and pays out 40, the ratio is 40%. The rest is kept in the business to fund growth, reduce debt or build reserves.

Can a dividend payout ratio be higher than 100%?

Yes, it can happen when a company pays out more than it earns, often in a year when profit has fallen. It is usually not sustainable for long because the shortfall must come from reserves, asset sales or borrowing. Investors typically check cash flow and debt to understand how the gap is being covered.

Is a lower dividend payout ratio always better?

Not necessarily. A lower ratio often leaves more room to maintain or grow the dividend, but it also means shareholders receive less income today. What matters is whether the ratio suits the company’s sector and earnings stability, and whether retained profit is being used productively.

What is the difference between payout ratio and dividend yield?

The payout ratio compares the dividend with the company’s earnings, while dividend yield compares it with the share price. The first speaks to sustainability and the second to the income offered at today’s price. Two companies can share the same payout ratio and have very different yields.

Turn insight into action with PhillipCapital DIFC

Speak with the team about accessing dividend-paying equities across global markets.

What Should Investors Remember About Payout Ratios?

The dividend payout ratio shows how much profit reaches shareholders and how much stays in the business. It is most useful when read over several years, compared within a sector and confirmed against free cash flow and debt, rather than judged as a single number.

A balanced ratio can suggest a company that rewards shareholders while keeping a buffer, while a very high or rising ratio can be an early prompt to look deeper. None of these signals guarantees an outcome, and dividends can be reduced or suspended at any time. Investors who build the habit of checking the ratio, the cash behind it and the context around it are better placed to understand the income they are counting on.

Disclaimer:

Trading foreign exchange and/or contracts for difference on margin carries a high level of risk, and may not be suitable for all investors as you could sustain losses in excess of deposits. The products are intended for retail, professional and eligible counterparty clients. Before deciding to trade any products offered by PhillipCapital (DIFC) Private Limited you should carefully consider your objectives, financial situation, needs and level of experience. You should be aware of all the risks associated with trading on margin. The content of the Website must not be construed as personal advice. For retail, professional and eligible counterparty clients. Before deciding to trade any products offered by PhillipCapital (DIFC) Private Limited you should carefully consider your objectives, financial situation, needs and level of experience. You should be aware of all the risks associated with trading on margin.

Rolling Spot Contracts and CFDs are complex instruments and come with a high risk of losing money rapidly due to leverage. 78% of our retail client accounts lose money while trading with us. You should consider whether you understand how Rolling Spot Contracts and CFDs work, and whether you can afford to take the high risk of losing your money.

peg ratio thumbnail

PEG ratio

PEG Ratio The Advanced Metric for Finding Growth at a...

Read More