
Dividend Aristocrats Dividend Aristocrats Explained: What They Are and How...
Read MoreDividend Growth Analysis
Dividend Growth Analysis: How Investors Judge Whether a Dividend Can Keep Rising
A company that pays a dividend today tells investors very little about what it will pay in five or ten years. Dividend growth analysis fills that gap. It studies how fast a dividend has risen, what funds those increases, and whether the business can keep funding them.
This guide starts from first principles. It explains how dividend growth is measured, which financial signals show that a payout is sustainable, how growth differs from chasing a high yield, and how the approach changes across US, global and GCC stocks. A worked comparison with hypothetical numbers shows why patience matters.
Everything here is educational. It describes how analysts think about dividends and does not recommend any security.
Table of Contents
- What Is Dividend Growth Analysis and Why Does It Matter?
- How Do Investors Measure Dividend Growth?
- Which Financial Signals Show a Dividend Can Keep Growing?
- How Is Dividend Growth Different From High Yield Investing?
- How Should Investors Read a Company’s Dividend History?
- What Does a Dividend Growth Comparison Look Like in Practice?
- How Does Dividend Growth Analysis Differ Across US, Global and GCC Stocks?
- What Role Do Inflation and Interest Rates Play?
- What Mistakes Do Investors Commonly Make?
- What Is a Practical Process for Analysing a Dividend Grower?
- Conclusion: What Should Investors Remember?
- Frequently Asked Questions About Dividend Growth Analysis
What Is Dividend Growth Analysis and Why Does It Matter?
Dividend growth analysis is the process of studying how a company’s dividend per share has changed over time and judging whether future increases are likely. It combines historical growth rates with tests of earnings, cash flow and debt, so investors can separate dependable income growth from payouts that may soon be cut.
A dividend is the share of a company’s profit paid out to its shareholders, usually in cash. Dividend per share (DPS) is that payment divided by the number of shares, and it is the figure most growth calculations start from. Because DPS is stated per share, it lets investors compare one year with the next, even when a company issues or buys back shares.
Growth matters for three reasons. A rising dividend can help income keep pace with rising prices. It often signals that management expects profits to keep expanding. It also feeds total return, which is the combination of dividends received and any change in the share price. For the wider investing philosophy behind this approach, see our overview of dividend growth investing.
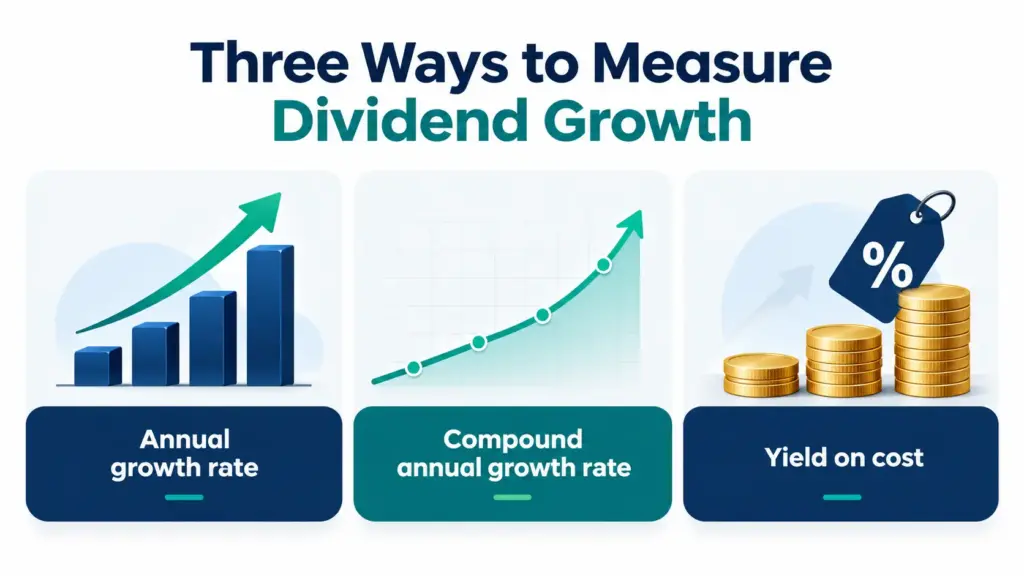
How Do Investors Measure Dividend Growth
Investors usually measure dividend growth with three tools: the annual dividend growth rate, the compound annual growth rate over several years, and yield on cost. The annual rate shows one year’s change, the compound rate smooths uneven years into one average, and yield on cost compares today’s dividend with the original purchase price.
The annual dividend growth rate
This is the simplest measure. Subtract last year’s dividend per share from this year’s, then divide the result by last year’s dividend.
Annual dividend growth rate = (this year’s DPS minus last year’s DPS) divided by last year’s DPS
If a company raises its dividend from 2.00 to 2.10 per share, the growth rate is 0.10 divided by 2.00, or 5%. A single year can mislead, because one unusually large or small raise distorts the picture.
The compound annual growth rate (CAGR)
CAGR is the steady yearly rate that would take a dividend from its starting value to its ending value over a set number of years. It smooths out lumpy increases, so it is better suited to judging a multi-year record.
CAGR = (ending DPS divided by starting DPS) raised to the power of 1 divided by the number of years, minus 1
Investors often calculate it over three, five and ten years. If the shorter periods show slower growth than the longer ones, the pace of increases may be fading.
Current yield versus yield on cost
Dividend yield is the annual dividend per share divided by the current share price. Our guide to dividend yield covers it in depth. Yield on cost uses the same dividend but divides it by the price an investor originally paid.
Yield on cost can look impressive for a long-held, fast-growing payer. It is a personal measure of income against purchase price, not a measure of how attractive the stock is today. Comparing it with current yield, and with other uses of the same capital, keeps the number in perspective.
Get started with US stocks
Research dividend payers across the world's largest equity market.
Which Financial Signals Show a Dividend Can Keep Growing?
A dividend can keep growing when earnings and free cash flow comfortably cover it, the payout ratio leaves room for increases, and debt stays manageable. Investors check these signals together, because a single healthy number can hide a weak spot elsewhere in the business.
The signals below tell different parts of the story:
- Earnings per share (EPS) growth: Rising EPS, which is net profit divided by the number of shares, gives a company the raw material for bigger dividends over time.
- Payout ratio: This is dividends divided by net profit. A very high ratio leaves little margin for error, while a moderate one leaves room to raise the dividend even if profits grow slowly.
- Free cash flow coverage: Free cash flow is the cash left after running the business and investing in it. Dividends are paid in cash, so cash coverage is often a stricter test than the profit-based payout ratio, and our free cash flow analysis guide explains how to read it.
- Debt and interest burden: A company that must devote a large share of cash to lenders has less to share with owners, and heavy borrowing can force a dividend cut when conditions tighten.
- Return on invested capital and business quality: Firms that earn healthy returns on the money they reinvest can fund growth and dividends at the same time.
No single threshold fits every industry. Utilities, banks and technology firms carry very different cash needs, so analysts compare a company with its own history and with similar businesses.
How Is Dividend Growth Different From High Yield Investing?
Dividend growth investing focuses on companies that raise payouts steadily, often from a modest starting yield. High yield investing focuses on the largest income today, which can signal either a mature, generous payer or a share price that has fallen because the market doubts the dividend.
The two approaches answer different questions. Growth asks where income will be in ten years. High yield asks how much income is available now. Neither is automatically better, and the right emphasis depends on an investor’s goals, time horizon and risk tolerance.
Dividend Growth vs High Yield vs Low-Yield Growth Stocks
| Feature | Dividend growth stocks | High yield stocks | Low-yield growth stocks |
|---|---|---|---|
| Starting income | Modest to moderate | Highest of the three | Very low or none |
| Income direction over time | Rising steadily | Often flat, sometimes falling | Rises only if dividends begin |
| Payout ratio profile | Moderate, leaving room to grow | Often high, leaving little room | Low, with profits reinvested |
| Main risk | Growth slows or stalls | Dividend is cut or the price falls | Little or no income to cushion price falls |
| Sensitivity to interest rates | Moderate | Often higher, as bonds compete for income | Often higher, as future profits are discounted more |
| Typical investor focus | Income that grows over time | Income received today | Price appreciation |
A very high yield deserves extra scrutiny. When a share price drops sharply, the yield rises mechanically even though nothing good has happened. Investors often call this a yield trap, and the payout ratio and cash coverage tests above help reveal it. Our article on Dogs of the Dow shows how one popular high-yield screening idea works and why its limits matter.
How Should Investors Read a Company's Dividend History?
A dividend history shows how reliably a company has treated shareholders through good and bad years. Investors look at the length of the record, the size and regularity of increases, and any freezes or cuts, then ask whether the same business conditions still apply today.
A long record of annual increases suggests a durable business and a management team that treats the dividend as a commitment. Some indexes publish lists of companies with long increase streaks, which can serve as a starting point for research. A streak is a clue, not a guarantee, because it describes the past rather than promising the future.
The pattern inside the record matters as much as its length. Small, regular increases often point to steady, planned policy, while a few large jumps after years of nothing may reflect a one-off windfall. Investors also separate regular dividends from special dividends, which are one-time extra payments that should not be counted as part of normal growth.
Finally, check what changed. A cut during a recession, followed by a full recovery, tells a different story from a cut caused by weak competitiveness or heavy borrowing. The reason behind any pause is usually more informative than the pause itself.
What Does a Dividend Growth Comparison Look Like in Practice?
A hypothetical comparison shows that a low yield with fast growth can eventually out-earn a higher flat yield, but only after many years. The result depends on growth continuing, so the example illustrates a mechanism rather than predicting any real company’s outcome.
Imagine two fictional companies. An investor pays 50 per share for each. Company A pays 1.00 per share in year one and raises it by 10% every year. Company B pays a flat 3.00 per share every year. All figures are rounded and purely illustrative, and they ignore taxes, share price changes and reinvestment.
Hypothetical Income Comparison, Company A (10% Growth) vs Company B (Flat Dividend)
| Year | Company A dividend per share | Company A yield on cost | Company B dividend per share | Company B yield on cost |
|---|---|---|---|---|
| 1 | 1.00 | 2.0% | 3.00 | 6.0% |
| 6 | 1.61 | 3.2% | 3.00 | 6.0% |
| 11 | 2.59 | 5.2% | 3.00 | 6.0% |
| 13 | 3.14 | 6.3% | 3.00 | 6.0% |
| 16 | 4.18 | 8.4% | 3.00 | 6.0% |
Company A’s annual dividend overtakes Company B’s in year 13. Total cash received is a different story: Company B stays ahead on cumulative income until about year 21, because it paid far more in the early years. That timing gap is the real cost of choosing growth, and it is why time horizon matters so much.
The example also hides the risks. If Company A’s growth slowed to 3%, the crossover would move out by many years or never arrive. Company B’s flat dividend would lose purchasing power if prices rise. Analysis is about testing how likely each path really is.
How Does Dividend Growth Analysis Differ Across US, Global and GCC Stocks?
The core method stays the same across markets, but payout habits, reporting calendars, currencies and tax treatment differ. US, global and GCC stocks each need slightly different questions, especially about how stable earnings are and how dividends reach an investor’s account.
US stocks, ETFs and ADRs. The US market has deep disclosure and a long tradition of regular, often quarterly, dividends, which makes growth records easy to compile. An American Depositary Receipt (ADR) is a US-traded certificate that represents shares of a non-US company, so its dividends depend on the foreign company’s policy and on exchange rates. PhillipCapital DIFC describes its offering on the US stocks, ETFs and ADRs page.
Global non-US stocks. Payout cultures differ. Some markets favour paying out most of their profits, leaving less room for growth, while others favour reinvestment and share buybacks. Dividends are declared in local currency, so an investor’s real income also moves with exchange rates. Details of access to other developed and emerging markets sit on the global equity trading page.
GCC stocks. Dividend payers in the region often include banks, telecoms and utilities. Earnings in some sectors follow commodity or property cycles, which can make payouts less steady, so analysts study how a dividend behaved through past downturns. Reporting calendars and payment schedules can also differ from the US pattern.
Across every market, tax treatment is a practical variable. Withholding rules on dividends differ by country and by investor circumstance, so investors should confirm the rules that apply to them before relying on any income projection.
Plan your GCC equity research
Study regional dividend payers with a DFSA-regulated broker.
What Role Do Inflation and Interest Rates Play?
Inflation and interest rates shape dividend growth by affecting company costs, borrowing expenses and the appeal of alternatives such as bonds. Rising dividends can help income keep pace with rising prices, but only when profits grow fast enough to fund them.
When inflation rises, companies with pricing power can pass higher costs to customers and protect profit margins, which supports dividend increases. Companies without that power see margins squeezed, and dividend growth often slows first. A dividend that grows slower than prices still loses real purchasing power.
Interest rates act in two ways. Higher rates raise the cost of servicing debt, which cuts into cash available for shareholders. They also make bonds and deposits more competitive for income, which can pressure the share prices of dividend stocks. Central bank decisions and the stage of the market cycle therefore belong in any dividend review, especially for borrowing-heavy sectors.
What Mistakes Do Investors Commonly Make?
The most common dividend investing mistakes are chasing the highest yield, ignoring how the payout is funded, and assuming past increases will continue. Avoiding them usually means testing every dividend against earnings, cash flow and debt before relying on it.
- Chasing yield alone: An unusually high yield often reflects a fallen share price and market doubt, not generosity, so it calls for deeper checks rather than excitement.
- Ignoring how the payout is funded: A dividend paid by borrowing or by selling assets cannot grow sustainably, however attractive the headline figure looks.
- Treating a streak as a promise: A long increase record describes history, and companies can and do end streaks when conditions change.
- Overlooking valuation: Paying a very high price for a good dividend grower can leave low returns, because the dividend may already be reflected in the share price.
- Concentrating in one sector: Dividend payers cluster in a few industries, so a portfolio built only on yield can carry hidden exposure to a single economic risk.
- Forgetting currency and tax effects: Income from foreign shares can change in value through exchange rates, and withholding taxes can reduce what actually arrives.
Investors may consider keeping notes on why each dividend holding was chosen, so that a later cut or slowdown can be reviewed against the original reasoning.
What Is a Practical Process for Analysing a Dividend Grower?
A practical dividend growth review follows six steps: confirm the record, measure the growth rate, test coverage by earnings and cash flow, check the balance sheet, consider valuation, and review the sector and currency context. Working in order keeps the analysis consistent from one company to the next.
- Confirm the record. Gather several years of dividend per share, separating regular payments from special ones.
- Measure the growth rate. Calculate annual and compound rates over three, five and ten years, and note whether growth is speeding up or slowing down.
- Test coverage. Compare dividends with earnings per share and with free cash flow, and check that both leave a sensible margin.
- Check the balance sheet. Review debt levels, upcoming debt maturities and interest costs relative to cash generated.
- Consider valuation. Ask whether the price already reflects strong dividend growth, using measures such as the price-to-earnings ratio alongside yield.
- Review context. Look at the sector’s cycle, the company’s currency exposure, tax treatment and its fit within overall asset allocation.
For structured study of these topics, the Dividend Investing section of our Learn menu gathers related educational material in one place.
Conclusion: What Should Investors Remember?
Dividend growth analysis asks whether a payout is both rising and sustainable. Growth rates describe the past, while coverage by earnings and free cash flow, manageable debt, sensible valuation and the market context help judge the future. A low starting yield with dependable growth can become meaningful income over time, but it asks for patience and carries its own risks.
No single ratio settles the question. Investors may consider combining several signals, comparing companies with their own history and their peers, and revisiting each conclusion when conditions change.
Frequently Asked Questions (FAQs)
How do you calculate the dividend growth rate?
Subtract last year’s dividend per share from this year’s and divide the result by last year’s figure. For multi-year records, use the compound annual growth rate, which smooths uneven increases. Comparing three, five and ten year results shows whether growth is accelerating or fading.
What is a good dividend growth rate?
There is no single good rate, because it depends on the industry, the company’s profit growth and its payout ratio. A growth rate that is faster than earnings growth cannot continue indefinitely. Analysts generally prefer increases that profits and cash flow can comfortably support.
Is dividend growth better than a high dividend yield?
Neither is better in every situation. Dividend growth aims for income that rises over time, while high yield aims for larger income now, often with more risk that the payout is cut. The right emphasis depends on an investor’s goals, time horizon and risk tolerance.
Can a company with a long record of dividend increases still cut its dividend?
Yes. A long streak shows past discipline but does not guarantee future payments. Falling profits, heavy debt or a major change in the business can all end a record, which is why coverage and balance sheet checks matter as much as the streak itself.
Speak with a team that covers global equities
Ask about account access, markets and platform features.
Disclaimer:
Trading foreign exchange and/or contracts for difference on margin carries a high level of risk, and may not be suitable for all investors as you could sustain losses in excess of deposits. The products are intended for retail, professional and eligible counterparty clients. Before deciding to trade any products offered by PhillipCapital (DIFC) Private Limited you should carefully consider your objectives, financial situation, needs and level of experience. You should be aware of all the risks associated with trading on margin. The content of the Website must not be construed as personal advice. For retail, professional and eligible counterparty clients. Before deciding to trade any products offered by PhillipCapital (DIFC) Private Limited you should carefully consider your objectives, financial situation, needs and level of experience. You should be aware of all the risks associated with trading on margin.
Rolling Spot Contracts and CFDs are complex instruments and come with a high risk of losing money rapidly due to leverage. 78% of our retail client accounts lose money while trading with us. You should consider whether you understand how Rolling Spot Contracts and CFDs work, and whether you can afford to take the high risk of losing your money.

Dividend Growth Analysis
Dividend Growth Analysis Dividend Growth Analysis: How Investors Judge Whether...
Read More
Dividend Payout Ratio
Dividend Payout Ratio Explained Dividend Payout Ratio Explained: How to...
Read More
Ex-Dividend Date Explained
Ex-Dividend Date Explained Ex-Dividend Date Explained: Rules, Timeline and Examples...
Read MoreCash and Stock Dividends
Cash and Stock Dividends Explained Cash and Stock Dividends Explained:...
Read More
Understanding Dividends
Dividend Investing: A Practical Guide for Beginners Dividend Investing: A...
Read More
Industry Growth Prospects
Industry Growth Prospects Table of Contents Introduction What Are Industry...
Read More
Regulatory Environment Impact
Regulatory Environment Impact on Stocks Table of Contents Introduction What...
Read More
Supply Chain Analysis
Supply Chain Analysis for Equity Investors Table of Contents Introduction...
Read More
Market Share Analysis
Market Share Analysis How Investors Measure Company Dominance in an...
Read More
Competitive Positioning
Competitive Positioning Table of Contents Introduction What Is Competitive Positioning...
Read More
Industry Analysis Framework
Sector Classification Systems Table of Contents Introduction What Is an...
Read More
Sector Classification Systems
Sector Classification Systems Introduction Every listed company belongs somewhere. Whether...
Read More
Working Capital Analysis
Working Capital Analysis Introduction When you look at a company’s...
Read More
Current Ratio vs Quick Ratio
Current Ratio and Quick Ratio Table of Contents Introduction What...
Read More
debt-to-equity ratio
Debt-to-Equity Ratio Table of Contents Introduction What is the Debt-to-Equity...
Read More

Profit Margins & Profitability
Profit Margins and Profitability Introduction When you look at a...
Read More
Revenue Growth Analysis
Revenue Growth Analysis Table of Contents Introduction What Is Revenue...
Read More
Statement of Changes in Equity
Statement of Changes in Equity Table of Contents Introduction What...
Read More
Cash Flow Statement Analysis
Cash Flow Statement Analysis Table of Contents Introduction What Is...
Read More
Understanding Balance Sheets
Understanding Balance Sheets Understanding Balance Sheets: A Complete Guide for...
Read More

Fundamental Analysis for Stocks
Fundamental Analysis for Stocks Mastering Fundamental Analysis for Stocks: A...
Read More
Discounted Cash Flow (DCF) Model
Discounted Cash Flow (DCF) Model Understanding the Discounted Cash Flow...
Read More
Intrinsic Value Calculation
Intrinsic Value Calculation Guide to Stock Valuations Intrinsic Value Calculation:...
Read More