
Dividend Aristocrats Dividend Aristocrats Explained: What They Are and How...
Read MoreDividend Aristocrats
Dividend Aristocrats Explained: What They Are and How Investors Evaluate Them
Few labels in income investing carry as much weight as Dividend Aristocrats. The term describes large US companies that have raised their dividend, the share of profit paid out to shareholders, every year for at least 25 years in a row. That span covers several recessions, interest rate cycles and market sell-offs.
This guide explains where the label comes from, how a company earns it and what it does and does not tell you. You will also see how it differs from similar labels, which risks sit behind a long dividend record, and how investors in the UAE can access these shares through a regulated broker.
Whether you are reading about dividend stocks for the first time or comparing income strategies, the aim is the same: to judge a track record on its merits rather than on the name alone.
Table of Contents
- What Are Dividend Aristocrats?
- How Does a Company Qualify as a Dividend Aristocrat?
- Why Do Investors Look at Dividend Aristocrats?
- How Are Dividend Aristocrats Different from Dividend Kings?
- How Do Dividend Yield, Payout Ratio and Dividend Growth Work Together?
- What Are the Risks of Investing in Dividend Aristocrats?
- How Can Investors in the UAE Access Dividend Aristocrats?
- How Can Investors Evaluate a Dividend Aristocrat Before Investing?
- What Mistakes Do Investors Make with Dividend Aristocrats?
- Are Dividend Aristocrats Worth Understanding?
- Frequently Asked Questions About Dividend Aristocrats
What Are Dividend Aristocrats?
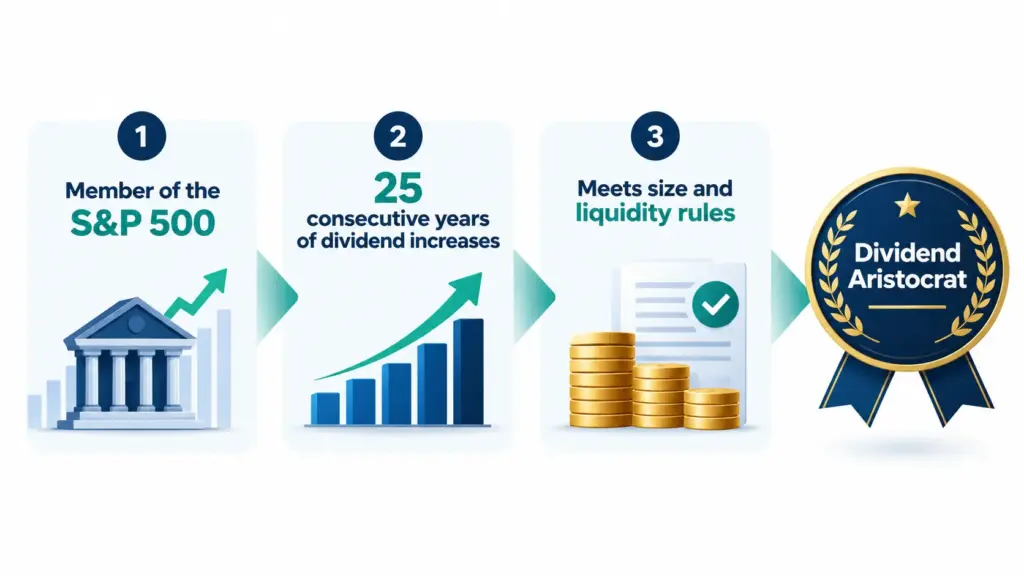
Dividend Aristocrats are companies in the S&P 500 that have increased their dividend every year for at least 25 consecutive years. The label comes from S&P Dow Jones Indices, which also publishes an index tracking the group. It describes a past record, not a promise about future payouts.
The S&P 500 is an index of 500 large US-listed companies and is often used as shorthand for the US stock market. A dividend is a portion of profit paid to shareholders, usually every quarter. A company that lifts that payment year after year signals confidence in its cash flow, and that is the behaviour the Aristocrats label recognises.
The S&P 500 Dividend Aristocrats index gives each member the same weight, a method called equal weighting. A mid-sized member therefore influences results as much as the largest one, so the index behaves differently from the S&P 500 itself, where the biggest companies dominate. Many members are blue-chip businesses, meaning large, established companies with long operating histories.

How Does a Company Qualify as a Dividend Aristocrat?
A company must belong to the S&P 500, have raised its total dividend per share every year for at least 25 consecutive years, and meet minimum size and liquidity requirements. S&P Dow Jones Indices reviews the qualifying list once a year in January, so companies can join or leave.
Qualification is rule-based rather than a judgement call. The core conditions are:
- The company must be a member of the S&P 500, which places smaller companies and most non-US companies outside this particular index.
- The company must have increased its total dividend per share every year for at least 25 consecutive years, and a cut or a freeze can end eligibility.
- The company must meet a minimum float-adjusted market capitalisation, which measures the value of only those shares available for the public to trade.
- The company must meet a minimum liquidity standard, meaning its shares trade often enough for investors to buy and sell without difficulty.
Because the list is reviewed annually, membership is not permanent. A company can drop out if it stops raising its payout, leaves the S&P 500, or no longer meets the size and liquidity tests. Investors should always check the current constituent list rather than rely on an old article or a remembered name.
Explore US Stocks and ETFs on a Regulated Platform
See which deliverable equity products PhillipCapital DIFC offers to investors in the UAE.
Why Do Investors Look at Dividend Aristocrats?
Investors study Dividend Aristocrats because a long record of rising payouts often points to resilient earnings and disciplined management. A growing dividend can also help income keep pace with inflation over time. The record is a screening tool, though, and it does not protect a portfolio from falling share prices.
The main reasons investors pay attention to the group are:
- Rising income: each increase lifts the cash an investor receives per share, which matters to people who want regular income from equities.
- A quality filter: staying on the list for 25 years usually requires steady cash generation, so the group leans toward established businesses.
- Sector spread: membership is rule-based and spans several industries, which supports diversification, although some sectors typically carry more weight than others.
- Compounding potential: investors who reinvest dividends buy extra shares, and rising payouts can magnify that effect over long holding periods.
Dividend Aristocrats focus on the growth of the payout rather than the size of today’s yield. The Dogs of the Dow strategy takes a different route by favouring the highest-yielding members of the Dow Jones Industrial Average, while dividend growth investing is the wider approach that the Aristocrats label fits into.
How Are Dividend Aristocrats Different from Dividend Kings?
Dividend Aristocrats need 25 years of increases within the S&P 500. Dividend Kings need 50 years and are not tied to one index. High-yield versions of the Aristocrats concept shorten the streak to 20 years in exchange for a yield screen. A longer streak does not automatically make a better investment.
The table below compares the three labels most often used in dividend research.
Dividend Aristocrats vs Dividend Kings vs High Yield Dividend Aristocrats
| Feature | Dividend Aristocrats | Dividend Kings | S&P High Yield Dividend Aristocrats |
|---|---|---|---|
| Required streak of annual increases | 25 consecutive years | 50 consecutive years | 20 consecutive years |
| Stock universe | S&P 500 members only | Informal label, not limited to one index | S&P Composite 1500 members |
| Official index | S&P 500 Dividend Aristocrats | Informal label; S&P also publishes a Dividend Monarchs index | S&P High Yield Dividend Aristocrats |
| Weighting approach | Equal weighting | Depends on the product using the label | Weighted by dividend yield, subject to caps |
| Main investor focus | Dividend growth with established size | Extreme dividend longevity | Higher current income with a growth record |
Every Dividend King has a streak long enough to qualify as an Aristocrat, but a King does not have to belong to the S&P 500. Investors comparing these labels should check the exact rules of any fund or list they use, since methodologies differ between providers.
How Do Dividend Yield, Payout Ratio and Dividend Growth Work Together?
Dividend yield shows the income paid relative to the share price. Payout ratio shows what share of earnings is paid out. Dividend growth rate shows how quickly the payment is rising. Read together, they reveal whether an income stream looks sustainable rather than merely attractive today.
Dividend yield
Dividend yield equals the annual dividend per share divided by the current share price. A rising share price lowers the yield, and a falling price raises it. That is why a very high yield can signal market worry about a company rather than a bargain.
Payout ratio
Payout ratio equals dividends divided by earnings, often measured per share using EPS (earnings per share). A moderate ratio leaves profit available to reinvest in the business. A ratio near or above 100% means the company is paying out as much as it earns, which leaves little room for future increases.
Dividend growth rate
Dividend growth rate measures how fast the annual payment is increasing. For Aristocrats, even small increases count toward the streak, so investors often look at the size of the increases as well as their consistency.
A simple illustration. Suppose a hypothetical company trades at $100 per share, pays $2.50 per share annually and earns $6.25 per share. Its yield is 2.5% ($2.50 divided by $100) and its payout ratio is 40% ($2.50 divided by $6.25). If the dividend rises 6% to $2.65 next year, the growth rate is 6%. Now imagine the share price halves to $50 while the dividend stays at $2.50: the yield doubles to 5%, yet the higher number reflects a weaker share price, not a better business. This example is for learning only and does not describe any real company.
These ratios sit alongside other valuation tools such as the P/E (price-to-earnings) ratio.
What Are the Risks of Investing in Dividend Aristocrats?
The main risks are that dividends are never guaranteed, share prices can still fall, and the group can be concentrated in a few sectors. A 25-year record shows resilience in the past, but companies can cut or freeze payouts when business conditions change.
Investors should weigh these risk factors:
- Dividend risk: a company can freeze or cut its dividend at any time, and the streak ends the moment that happens.
- Market risk: Aristocrats are still equities, so their share prices can fall materially during market downturns, and volatility, the size of price swings, applies to them as it does to any stock.
- Interest rate sensitivity: when central banks raise interest rates, income-oriented shares may look less attractive compared with bonds or cash, which can weigh on their prices.
- Sector concentration: an equal-weighted group can still lean toward certain industries, so a downturn in those sectors can affect the whole holding.
- Opportunity cost: capital placed in slower-growing established companies may trail the market during periods when faster-growing companies lead.
- Backward-looking label: the label rests on history, and past dividend growth does not guarantee future dividends.
Risk management matters here. Diversification across sectors and asset classes, together with sensible position sizing, helps limit the damage if any single company disappoints.
How Can Investors in the UAE Access Dividend Aristocrats?
Most Dividend Aristocrats are US-listed companies, so UAE-based investors typically reach them through deliverable US stocks or through ETFs that track dividend growth indices. A DFSA-regulated broker such as PhillipCapital DIFC offers US Stocks, ETFs and ADRs, subject to onboarding and eligibility requirements.
There are two common routes:
- Direct shares: the investor buys shares of individual companies. Deliverable equities mean the shares are actually delivered to the investor’s account, so the investor owns the underlying stock. The US stocks, ETFs and ADRs product page sets out what is available.
- ETFs: an ETF, or exchange-traded fund, is a basket of securities that trades like a single share. Some ETFs track dividend growth indices, which offers instant diversification, but investors should read each fund’s documents to understand its index, holdings and costs.
Global versions of the concept also exist. S&P Dow Jones Indices publishes regional indices such as the S&P Europe 350 Dividend Aristocrats and the S&P Global Dividend Aristocrats. Companies listed in the Gulf also pay dividends, but the S&P criteria do not apply to them, so investors looking at GCC stocks need to study each company’s own payout history.
Two practical points apply to cross-border investing. First, dividends from US-listed shares may be subject to US withholding tax for non-US residents, and the treatment depends on the investor’s circumstances, so investors should confirm the position with a qualified tax adviser. Second, because the dirham is pegged to the US dollar, exchange rate swings on US-dollar assets are usually limited for dirham-based investors, but this does not reduce the risk of the share price itself falling.
Open the Door to US Dividend Growers
Review how PhillipCapital DIFC supports deliverable US stocks, ETFs and ADRs for investors in the UAE.
How Can Investors Evaluate a Dividend Aristocrat Before Investing?
Investors can evaluate a Dividend Aristocrat by checking the dividend record, the payout ratio, free cash flow, debt levels, valuation and portfolio fit. The label is only a starting point, and each company still needs its own review before any decision is made.
- Verify the streak. Confirm the dividend history in company reports and check that the company still appears on the current index list.
- Check the payout ratio. A ratio that has crept toward 100% leaves little room for future increases.
- Review free cash flow. Free cash flow is the cash left after operating costs and investment spending. Dividends are paid in cash, so a payout that exceeds free cash flow for long is a warning sign.
- Examine debt. Heavy borrowing can pressure dividends, especially when interest rates are high.
- Compare valuation. A strong record can already be reflected in the share price, so investors may compare the P/E ratio and yield against the company’s own history and its peers.
- Consider portfolio fit. Think about asset allocation and sector exposure. A holding that grows larger than planned can be trimmed through portfolio rebalancing.
Consider a hypothetical investor who holds three Aristocrats, all in the same sector. Each has a long dividend record, yet if that sector falls out of favour, all three shares may fall together. The individual records did not fail; the portfolio simply lacked diversification.
What Mistakes Do Investors Make with Dividend Aristocrats?
The most common mistakes are treating the label as a guarantee, chasing the highest yield, ignoring valuation, and overlooking concentration. Each one comes from reading a historical record as if it were a forecast.
- Assuming the label means safety: the streak shows past behaviour, and any company can cut its dividend if conditions change.
- Chasing the highest yield: a high yield can reflect a falling share price and a business under stress.
- Ignoring valuation: paying a very high price for a good company can reduce long-term returns even if the dividend keeps growing.
- Holding too few names or sectors: concentration raises the impact of a single disappointment.
- Treating shares like bonds: bonds have a contractual repayment schedule, while dividends are decided by a company’s board and share prices can move much more.
- Overlooking tax and costs: withholding tax, trading costs and fund fees all reduce the income an investor actually keeps.
Are Dividend Aristocrats Worth Understanding?
Yes, because they show how a rising payout reflects business quality, cash flow and capital discipline, all of which apply to any dividend-paying company. They are best treated as a research starting point rather than a shortcut, since a 25-year streak does not replace analysis of today’s fundamentals.
Investors who understand how the label is earned, how it differs from similar labels and which risks remain are better placed to read dividend research critically. Combining that understanding with diversification, sensible position sizing and a clear view of personal objectives is what turns a list of names into a considered approach.
Frequently Asked Questions (FAQs)
Whether they suit an investor depends on that investor’s objectives, time horizon and risk tolerance. Dividend Aristocrats have a record of rising payouts, but they remain equities whose prices can fall. Investors should evaluate each company individually and consider how it fits their wider portfolio.
The number changes each year because S&P Dow Jones Indices reviews the qualifying list every January. The current constituents are published by S&P Dow Jones Indices, and investors should use that source rather than older articles, since companies are added and removed over time.
Yes, any company can cut or freeze its dividend. When that happens, the streak ends and the company is no longer eligible at the next annual review. A long record lowers the likelihood in the eyes of many investors, but it never removes the possibility.
UAE-based investors can generally access US-listed shares and ETFs through a regulated broker, subject to the broker’s onboarding and eligibility rules. Taxes such as US withholding tax on dividends may apply, so investors should confirm their own position with a qualified tax adviser.
Speak With Our Team About Your Account Options
Ask how PhillipCapital DIFC can support your access to global equities and ETFs.
Disclaimer:
Trading foreign exchange and/or contracts for difference on margin carries a high level of risk, and may not be suitable for all investors as you could sustain losses in excess of deposits. The products are intended for retail, professional and eligible counterparty clients. Before deciding to trade any products offered by PhillipCapital (DIFC) Private Limited you should carefully consider your objectives, financial situation, needs and level of experience. You should be aware of all the risks associated with trading on margin. The content of the Website must not be construed as personal advice. For retail, professional and eligible counterparty clients. Before deciding to trade any products offered by PhillipCapital (DIFC) Private Limited you should carefully consider your objectives, financial situation, needs and level of experience. You should be aware of all the risks associated with trading on margin.
Rolling Spot Contracts and CFDs are complex instruments and come with a high risk of losing money rapidly due to leverage. 78% of our retail client accounts lose money while trading with us. You should consider whether you understand how Rolling Spot Contracts and CFDs work, and whether you can afford to take the high risk of losing your money.
Dividend Growth Analysis
Dividend Growth Analysis Dividend Growth Analysis: How Investors Judge Whether...
Read MoreDividend Payout Ratio

Dividend Payout Ratio Explained Dividend Payout Ratio Explained: How to...
Read MoreEx-Dividend Date Explained

Ex-Dividend Date Explained Ex-Dividend Date Explained: Rules, Timeline and Examples...
Read MoreCash and Stock Dividends
Cash and Stock Dividends Explained Cash and Stock Dividends Explained:...
Read MoreUnderstanding Dividends

Dividend Investing: A Practical Guide for Beginners Dividend Investing: A...
Read MoreIndustry Growth Prospects

Industry Growth Prospects Table of Contents Introduction What Are Industry...
Read MoreRegulatory Environment Impact

Regulatory Environment Impact on Stocks Table of Contents Introduction What...
Read MoreSupply Chain Analysis

Supply Chain Analysis for Equity Investors Table of Contents Introduction...
Read MoreMarket Share Analysis

Market Share Analysis How Investors Measure Company Dominance in an...
Read MoreCompetitive Positioning

Competitive Positioning Table of Contents Introduction What Is Competitive Positioning...
Read MoreIndustry Analysis Framework

Sector Classification Systems Table of Contents Introduction What Is an...
Read MoreSector Classification Systems

Sector Classification Systems Introduction Every listed company belongs somewhere. Whether...
Read MoreWorking Capital Analysis

Working Capital Analysis Introduction When you look at a company’s...
Read MoreCurrent Ratio vs Quick Ratio

Current Ratio and Quick Ratio Table of Contents Introduction What...
Read Moredebt-to-equity ratio
Debt-to-Equity Ratio Table of Contents Introduction What is the Debt-to-Equity...
Read MoreProfit Margins & Profitability
Profit Margins and Profitability Introduction When you look at a...
Read MoreRevenue Growth Analysis
Revenue Growth Analysis Table of Contents Introduction What Is Revenue...
Read MoreStatement of Changes in Equity
Statement of Changes in Equity Table of Contents Introduction What...
Read MoreCash Flow Statement Analysis
Cash Flow Statement Analysis Table of Contents Introduction What Is...
Read MoreUnderstanding Balance Sheets
Understanding Balance Sheets Understanding Balance Sheets: A Complete Guide for...
Read MoreFundamental Analysis for Stocks

Fundamental Analysis for Stocks Mastering Fundamental Analysis for Stocks: A...
Read MoreDiscounted Cash Flow (DCF) Model

Discounted Cash Flow (DCF) Model Understanding the Discounted Cash Flow...
Read MoreIntrinsic Value Calculation

Intrinsic Value Calculation Guide to Stock Valuations Intrinsic Value Calculation:...
Read More