Repurchase Agreement (Repo) Introduction Every day, banks, governments, and institutional...
Read MoreFixed Income Yield Curve

Table of Contents
- Introduction
- What Is the Fixed Income Yield Curve?
- Why Does the Yield Curve Matter to Investors?
- What Are the Different Shapes of the Yield Curve?
- What Causes the Yield Curve to Shift?
- What Is Yield Curve Inversion and Why Does It Attract Attention?
- How Can Investors Use the Yield Curve in Their Strategy?
- Frequently Asked Questions
- Conclusion and Key Takeaways
Introduction
For anyone building a fixed income portfolio, the yield curve is one of the most useful tools available. It is a simple line on a chart, yet it carries a great deal of information about interest rates, economic expectations, and investor sentiment. Many new investors hear the term and assume it is only relevant to economists or central bankers, but in reality, understanding the yield curve can help everyday bond investors make better decisions about where to place their money and for how long. Whether you already hold government or corporate bonds, or you are still learning the fundamentals covered in our guide to bond basics, this article will give you a clear, practical understanding of what the yield curve is and how to read it.

What Is the Fixed Income Yield Curve?
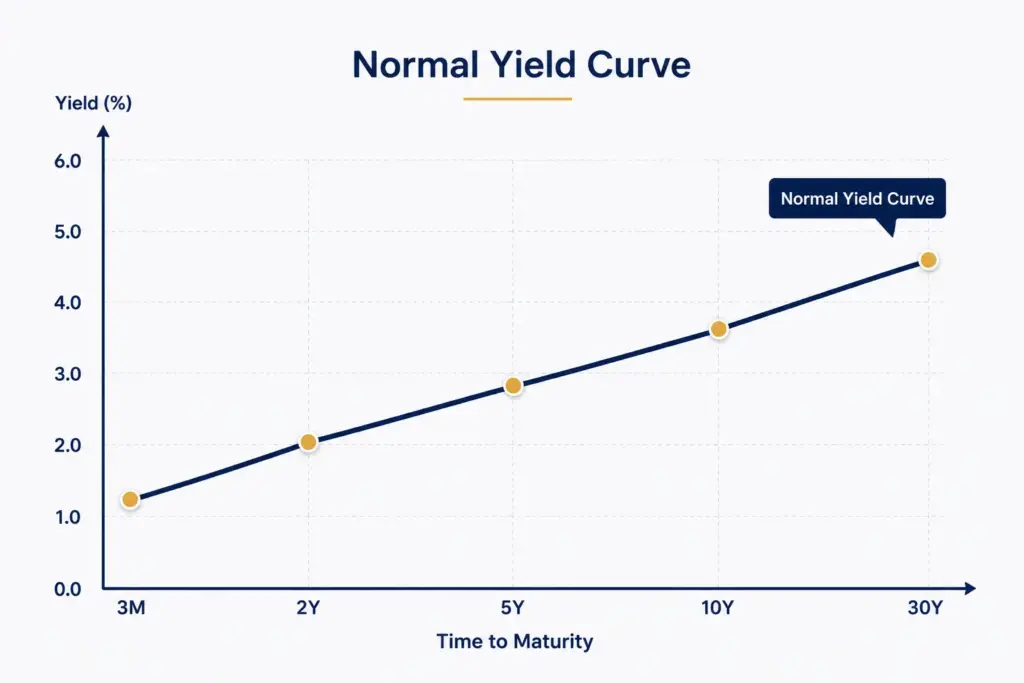
The fixed income yield curve is a graph that plots the interest rates, or yields, of bonds with the same credit quality but different maturity dates. Typically, government bonds are used to build this curve because they are considered a benchmark of low risk within a country’s debt market. On the horizontal axis, you will see the time to maturity, ranging from a few months to thirty years. On the vertical axis, you will see the yield, expressed as a percentage.
In most stable economic conditions, longer-term bonds pay a higher yield than shorter-term bonds. This happens because investors generally want to be compensated for locking their money away for a longer period, since there is more uncertainty about inflation, interest rates, and the borrower’s financial health further into the future. This relationship between maturity and yield is often referred to as the “term structure of interest rates,” and the yield curve is simply the visual representation of that structure.
It is worth noting that the shape of the curve can differ depending on which bonds you are analyzing. A curve built purely from short-dated instruments will look very different from one that spans the full range of maturities described in our overview of bond types and structures. Understanding which segment of the curve you are looking at is just as important as understanding the shape itself.
Why Does the Yield Curve Matter to Investors?
The yield curve is not just an academic concept; it has real, practical consequences for how you construct a fixed income portfolio. First, it helps you compare the extra yield you receive for extending your investment horizon. If the curve is steep, meaning long-term yields are significantly higher than short-term yields, it may be more rewarding to hold longer-dated bonds, provided you are comfortable with the added interest rate risk. This risk is closely tied to the concept of duration, which we explain in detail in our article on bond duration and risk.
Second, the yield curve is widely used as an economic indicator. Because bond yields reflect the collective expectations of thousands of market participants regarding inflation, growth, and central bank policy, changes in the curve’s shape can signal shifts in the broader economic outlook well before those shifts show up in official data. Professional fund managers, banks, and institutional investors watch the curve closely for exactly this reason.
Third, for anyone actively pricing bonds or comparing new issues, the yield curve serves as a reference point. When a new bond is issued, its coupon rate is usually set relative to the prevailing yield curve for similar maturities. This is one of the reasons the yield curve is such a central topic within our broader coverage of bond pricing and valuation.
A Quick Word on Credit Quality
It is important to remember that the standard yield curve is built from bonds of similar credit quality, usually sovereign or government debt. Corporate bonds, including those with lower credit ratings, will sit above the base government curve, with the additional yield reflecting the extra credit risk the investor is taking on.
Explore Global Bond Opportunities
Access sovereign and corporate bonds across global markets with PhillipCapital DIFC.
What Are the Different Shapes of the Yield Curve?
The yield curve does not always slope gently upward. Over time, it can take on several distinct shapes, each carrying its own meaning for investors.
Normal (Upward-Sloping) Curve: This is the most common shape, where long-term yields are higher than short-term yields. It generally reflects a healthy, growing economy with moderate inflation expectations.
Flat Curve: Here, short-term and long-term yields converge to similar levels. A flat curve often appears during a transition period, when the market is uncertain about the direction of future interest rates or economic growth.
Inverted Curve: In this less common but closely watched shape, short-term yields exceed long-term yields. An inverted curve has historically been associated with slowing economic growth, and in some cases, has preceded periods of recession, although the timing and strength of this relationship can vary.
Steep Curve: A steep curve shows a large gap between short and long-term yields, often appearing early in an economic recovery when growth and inflation expectations are rising quickly from a low base.
Recognizing these shapes helps investors align their fixed income strategy with the broader market cycle, rather than looking at individual bond yields in isolation.

What Causes the Yield Curve to Shift?
Several factors influence the shape and position of the yield curve at any given time.
Central Bank Policy: Short-term interest rates are heavily influenced by central bank decisions. When a central bank raises its policy rate to control inflation, short-term yields typically rise, which can flatten or even invert the curve if long-term expectations do not move at the same pace.
Inflation Expectations: Long-term yields tend to reflect investors’ expectations for inflation over the life of the bond. If investors expect inflation to rise, they will typically demand higher yields on longer-dated bonds to preserve their purchasing power.
Economic Growth Outlook: Strong expected growth generally pushes yields higher across maturities, as investors anticipate higher borrowing costs and stronger returns from alternative investments such as equities.
Supply and Demand for Bonds: Government borrowing needs, foreign investment flows, and demand from institutions such as pension funds all affect bond prices and, in turn, yields. Heavy demand for long-dated bonds, for instance, can push their yields down relative to shorter maturities.
Global Market Sentiment: In an interconnected market, yield curves in major economies can influence one another, particularly as investors move capital between regions in search of better risk-adjusted returns.
What Is Yield Curve Inversion and Why Does It Attract Attention?
Yield curve inversion occurs when short-term bond yields rise above long-term bond yields, reversing the typical relationship. This is widely discussed in financial media because, historically, inversions in certain benchmark curves have appeared before economic slowdowns in some major economies.
The logic behind this pattern is that when investors expect weaker growth or lower inflation ahead, they are willing to accept lower yields on long-term bonds in exchange for the perceived safety of locking in rates before they potentially fall further. At the same time, short-term rates may remain elevated because central banks are still holding policy rates high to manage current inflation.
It is important for investors to treat inversion as one signal among many, rather than a guaranteed predictor of what will happen next. The timing between an inversion and any subsequent economic slowdown has varied considerably across different cycles, and other indicators, including corporate earnings, employment data, and consumer spending, should be considered alongside the yield curve for a fuller picture.
Build a Resilient Fixed Income Portfolio
Get tailored guidance on structuring bond and note allocations to match your risk profile.
How Can Investors Use the Yield Curve in Their Strategy?
Understanding the yield curve is only useful if it informs actual investment decisions. Here are some practical ways investors apply this knowledge.
Matching Maturity to Objectives
If the curve is steep, investors seeking income may consider extending duration to capture higher long-term yields, provided they are comfortable holding the position through potential interest rate fluctuations. Conversely, in a flat or inverted environment, shorter maturities may offer a more attractive yield relative to the risk taken on.
Laddering Bond Portfolios
A bond ladder involves holding bonds across a range of maturities so that a portion of the portfolio matures regularly. This approach reduces the risk of being forced to reinvest a large sum at an unfavorable point on the curve, and it works well regardless of whether the curve is upward-sloping, flat, or inverted.
Assessing Relative Value
Comparing where a specific bond’s yield sits relative to the benchmark curve helps investors judge whether it is fairly priced, cheap, or expensive relative to similar instruments. This kind of relative value analysis is a core part of fixed income research and ties closely into broader market analysis found in our coverage of fixed income markets.
Timing Entry and Exit Points
Some investors use shifts in the yield curve as one input, among several, when deciding whether to add duration, reduce it, or rotate between government and corporate exposure.
Conclusion and Key Takeaways
The fixed income yield curve is a straightforward but powerful tool for understanding where interest rates stand today and what the market expects for tomorrow. By learning to read its shape, whether normal, flat, steep, or inverted, investors gain a clearer sense of economic conditions and can make more informed decisions about bond selection and portfolio duration.
Key Takeaways:
- The yield curve plots bond yields against their time to maturity, typically using government bonds as the benchmark.
- A normal upward-sloping curve reflects healthy growth expectations, while flat or inverted curves often signal uncertainty or a potential slowdown.
- Central bank policy, inflation expectations, and supply and demand all influence the curve’s shape over time.
- Investors can apply yield curve insights through strategies such as bond laddering, duration matching, and relative value analysis.
- The curve works best as one part of a broader analytical toolkit, alongside credit research and macroeconomic data.
If you would like to discuss how current yield curve conditions might apply to your own fixed income allocation, our team at PhillipCapital DIFC is available to help you build a strategy suited to your goals.
Frequently Asked Questions (FAQs)
A flat yield curve means there is little difference between short and long-term bond yields. It often signals market uncertainty about future growth or interest rates, and it can be a good time to hold a mix of maturities rather than concentrating in one segment.
Not always. It has been a historically reliable warning sign in some markets, but the timing and outcome can vary. It is best viewed as one signal alongside other economic data, not a standalone prediction.
The curve can shift daily based on economic data, central bank statements, and market sentiment, though major shape changes, such as moving from normal to inverted, usually happen gradually over months.
No. Each country’s yield curve reflects its own interest rate policy, inflation outlook, and economic conditions, so curves can differ significantly between markets even during the same period.
Disclaimer:
Trading foreign exchange and/or contracts for difference on margin carries a high level of risk, and may not be suitable for all investors as you could sustain losses in excess of deposits. The products are intended for retail, professional and eligible counterparty clients. Before deciding to trade any products offered by PhillipCapital (DIFC) Private Limited you should carefully consider your objectives, financial situation, needs and level of experience. You should be aware of all the risks associated with trading on margin. The content of the Website must not be construed as personal advice. For retail, professional and eligible counterparty clients. Before deciding to trade any products offered by PhillipCapital (DIFC) Private Limited you should carefully consider your objectives, financial situation, needs and level of experience. You should be aware of all the risks associated with trading on margin.
Rolling Spot Contracts and CFDs are complex instruments and come with a high risk of losing money rapidly due to leverage. 78% of our retail client accounts lose money while trading with us. You should consider whether you understand how Rolling Spot Contracts and CFDs work, and whether you can afford to take the high risk of losing your money.
Understanding the Money Market
Understanding the Money Market Introduction Every investor eventually asks the...
Read MoreBond Trading Mechanics

Bond Trading Mechanics Table of Contents Introduction What Does Bond...
Read MorePrimary vs Secondary Bond Markets
Primary vs Secondary Bond Markets Table of Contents Introduction What...
Read MoreBond Market Structure and Participants
Bond Market Structure and Participants Table of Contents Introduction What...
Read MoreDeferred Coupon Bonds
Perpetual Bonds Table of Contents Introduction What Are Deferred Coupon...
Read MoreInflation-Linked Bonds
Inflation-Linked Bonds Introduction Inflation is the silent tax that erodes...
Read MoreConvertible Bonds Basics
Convertible Bonds Explained: Structure, Benefits, and Risks for Investors Table...
Read MoreCallable and Putable Bonds
Callable and Putable Bonds Table of Contents Introduction What Is...
Read MoreMunicipal Bonds and Tax Implications

Municipal Bonds & Tax Implications Introduction When investors look for...
Read MoreCorporate Bonds and Corporate Credit

Government Bonds & Treasury Securities Guide Table of Contents Introduction...
Read MoreGovernment Bonds & Treasury Securities
Government Bonds & Treasury Securities Guide Introduction When markets get...
Read MorePrepayment Risk and Extension Risk

Prepayment Risk & Extension Risk in Bonds Understanding Prepayment Risk...
Read MoreLiquidity Risk in Fixed Income

Liquidity Risk in Fixed Income Understanding Liquidity Risk in Fixed...
Read MoreInterest Rate Risk Management

Interest Rate Risk Management Master Interest Rate Risk Management in...
Read MoreBond Duration & Interest Rate Risk Explained

Bond Duration & Interest Rate Risk Explained Table of Contents...
Read MoreMacaulay Duration Explained

Macaulay Duration Explained Macaulay Duration Explained: A Comprehensive Guide for...
Read MoreModified Duration and Its Impact on Price

Modified Duration and Its Impact on Bond Prices Introduction Navigating...
Read MoreUnderstanding Bond Duration

Understanding Bond Duration Introduction When stepping into the fixed-income market,...
Read MoreBond Valuation Methods and Formulas
Bond Valuation Methods Mastering Bond Valuation Methods and Formulas: A...
Read MoreThe Inverse Relationship Between Bond Prices and Yields

The Inverse Relationship Between Bond Prices and Yields Table of...
Read MoreCurrent Yield vs Yield to Maturity
Understanding Current Yield vs. Yield to Maturity Understanding Current Yield...
Read MoreBond Yield Vs Interest Rates

Bond Yield Vs Interest Rates Understanding the Relationship Between Bond...
Read More