
Rainbow Products Explained November 18, 2026 PhillipCapital DIFC Research Team...
Read MoreFundamental Analysis for Bonds
Fundamental Analysis for Bonds: How to Judge Value, Credit Quality and Risk
A bond looks simple on the surface: you lend money, collect interest and get your principal back at maturity. The real question is whether the borrower will actually do that, and whether the yield on offer fairly pays you for the risk. Fundamental analysis is the method investors use to answer both questions.
This guide walks through the full process. You will learn which economic forces move bond prices, how to read an issuer’s finances, what credit ratings can and cannot tell you, how government and corporate bonds are analysed differently, and how yield, credit spread and duration fit together. A worked example near the end shows the steps in action.
Whether you are buying your first bond or reviewing a fixed income allocation, the aim is the same: to understand what you own and why it is priced the way it is.
Table of Contents
- What is fundamental analysis for bonds?
- Which economic factors move bond prices and yields?
- How do you assess an issuer’s financial strength?
- What do credit ratings tell you, and where do they fall short?
- How does government bond analysis differ from corporate bond analysis?
- What do yield, credit spread and duration reveal about value?
- How do the pieces fit together in a worked example?
- How can investors access bonds through PhillipCapital DIFC?
- What mistakes should bond investors avoid?
- Frequently Asked Questions
- Conclusion

What is fundamental analysis for bonds?
Fundamental analysis for bonds is the process of judging whether an issuer can keep paying interest and repay principal, and whether the bond’s yield fairly rewards that risk. It combines economic conditions, the issuer’s finances, the bond’s legal terms and its market price into one view of value.
Stock analysis often focuses on growth and upside. Bond analysis starts from a different place. A bondholder’s best outcome is usually fixed: all coupons (the regular interest payments) plus the face value at maturity. The downside is much larger, because a default can wipe out a large share of the investment. That asymmetry is why bond investors spend most of their effort on what could go wrong.
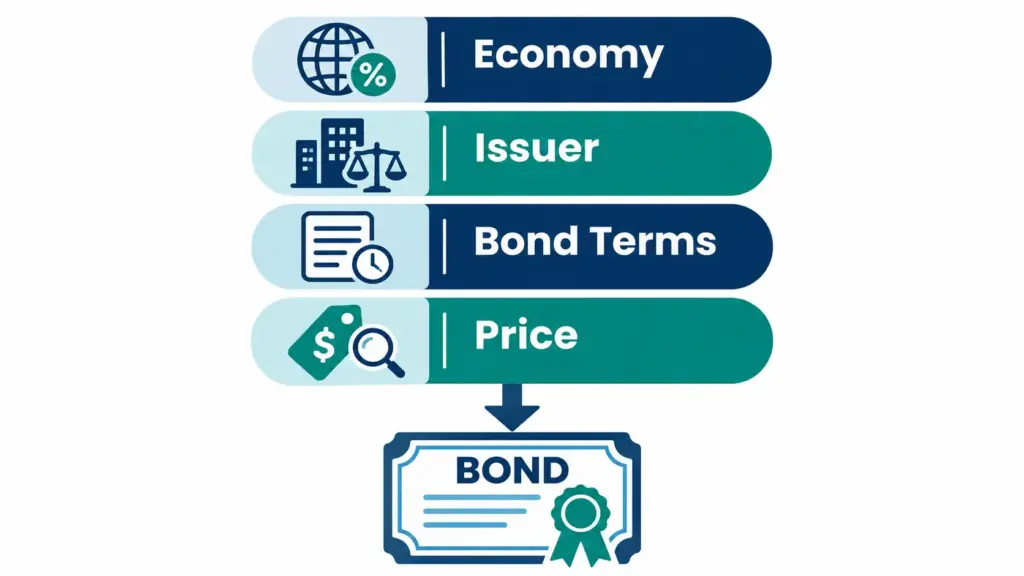
A complete bond review works through four layers:
- The economy: interest rates, inflation and growth set the background yield that every bond competes against.
- The issuer: earnings, debt levels and cash flow, or for governments, the fiscal and external position, decide whether payments can be made.
- The bond itself: maturity, seniority, security and features such as call options decide how the investor is treated if conditions change.
- The price: yield and credit spread show whether the market already charges enough for the risks above.
If you are new to terms such as face value and coupon rate, the bond basics lessons cover them step by step before you continue here.
Which economic factors move bond prices and yields?
Interest rates, inflation, economic growth and central bank policy move bond prices the most. When market yields rise, the prices of existing bonds fall, and when yields fall, prices rise. Inflation matters because it erodes the real value of a fixed coupon, so higher inflation expectations usually push yields up.
The main macro drivers are easy to list, but each one works through a different channel:
- Central bank policy rates: short-term yields follow policy rates closely, and expectations of future rate changes shape longer maturities.
- Inflation expectations: investors demand a higher yield when they expect prices to rise faster, because the fixed payments will buy less.
- Economic growth: strong growth tends to lift yields, while a slowdown often pulls government bond yields lower as investors look for safety.
- Government borrowing: heavy issuance can pressure prices if demand does not keep pace.
- Currency: a bond in a foreign currency adds exchange rate risk on top of credit and rate risk. The UAE dirham is pegged to the US dollar, so US interest rate moves are especially relevant to investors based in the UAE.
Reading the yield curve
The yield curve plots the yield of bonds of the same type and credit quality across different maturities. A normal curve slopes upward because investors ask for more yield to lend for longer. A flat curve shows little difference between short and long maturities. An inverted curve slopes downward, with short-term yields above long-term yields.
Inverted curves have often drawn attention as a possible sign of slower growth ahead, but they are a signal to weigh alongside other evidence, not a forecast. The curve is best used as context for pricing, not as a trading trigger.
Turn research into a plan with the full product range
Review every market and product available through a DFSA-regulated brokerage in Dubai
How do you assess an issuer's financial strength?
To assess a corporate issuer, investors examine how much debt it carries, how comfortably its earnings cover interest, how much cash the business generates and how close its debt repayments are. The goal is to judge repayment capacity, not to predict the share price.
Corporate credit analysis leans on a small group of measures. The table below sets out what each one shows and how to read it.
Core credit measures for corporate bonds
| Measure | What it shows | How to read it |
|---|---|---|
| Debt to EBITDA | Total debt divided by earnings before interest, tax, depreciation and amortisation | Lower generally means the company could repay debt from earnings sooner |
| Interest coverage | Earnings (EBIT or EBITDA, stated clearly) divided by interest expense | Higher means more room for earnings to fall before interest is at risk |
| Free cash flow to debt | Cash left after operating costs and investment, relative to total debt | Consistent positive cash flow supports repayment without new borrowing |
| Current ratio | Short-term assets divided by short-term liabilities | A figure well below 1 can signal pressure to refinance or sell assets |
| Margin trend | Operating profit as a share of revenue over several years | Shrinking margins can weaken coverage even if revenue grows |
No single number settles the question. Investors usually compare each measure with the issuer’s own history and with similar companies in the same sector, because a utility and a retailer can carry very different debt loads safely.
Leverage and coverage
Leverage tells you how much borrowing sits on the balance sheet. Coverage tells you how easily the business can pay for it. A company can have high debt and still be sound if earnings are stable and predictable. A company with modest debt can be fragile if profits swing sharply with the economic cycle.
Cash flow and the maturity schedule
Profit and cash are not the same. Investors look at the cash flow statement to see whether earnings turn into spendable cash. They also check when the issuer’s debts fall due. A large amount maturing in a single year creates refinancing risk, which is the danger that the company cannot roll over its debt on acceptable terms.
Seniority, security and covenants
Two bonds from the same issuer can carry different risk. Senior bonds rank ahead of subordinated bonds when a company cannot pay, and secured bonds are backed by specific assets. Covenants are promises in the bond contract, such as limits on additional borrowing. The offering documents set these out, and they can matter as much as the headline ratios.
The U.S. Securities and Exchange Commission explains in its investor bulletin on corporate bonds that credit risk is the risk an issuer fails to make timely interest or principal payments, and that credit ratings try to estimate it.
What do credit ratings tell you, and where do they fall short?
Credit ratings are opinions from agencies about how likely an issuer or bond is to meet its payment obligations. They give investors a quick, standardised starting point, but they lag events, differ between agencies and should never replace your own review of the issuer’s finances.
Agencies such as S&P Global Ratings, Moody’s and Fitch each use their own scales. Bonds rated at or above a set threshold are called investment grade, and those below it are called non-investment grade, high yield or speculative. Lower-rated issuers generally have to offer higher yields to attract buyers, which is the trade-off between income and credit risk.
The SEC’s investor bulletin on credit ratings describes ratings as a relative ranking of credit risk. That wording is a useful reminder of their limits:
- A rating is an opinion, not a guarantee. Even highly rated bonds can lose value when yields rise or when an issuer’s position weakens.
- Ratings change over time. A downgrade can lower a bond’s price before any payment is missed.
- Agencies can disagree. Differences between ratings from separate agencies are a cue to read the underlying reports.
- Two bonds with the same rating can trade at different yields. The market may see different risks that the rating does not capture.
A sensible habit is to use the rating to narrow the field, then verify the story with the issuer’s financial statements.
How does government bond analysis differ from corporate bond analysis?
Government bond analysis centres on a country’s fiscal position, economic strength and ability to raise revenue, while corporate analysis centres on a company’s earnings, cash flow and balance sheet. Government bonds from stable issuers are often used as the benchmark that other yields are measured against.
Government bonds compared with corporate bonds
| Comparison point | Government bonds | Corporate bonds |
|---|---|---|
| Main source of repayment | Tax revenue, borrowing and, for some countries, other national resources | Business earnings, cash flow and asset sales |
| Key analysis inputs | Debt relative to the size of the economy, budget balance, growth, external position, policy credibility | Leverage, coverage, margins, cash flow, sector outlook, management and covenants |
| Currency effect | Debt in the country’s own currency carries different risk from debt in a foreign currency | Depends on the currency of the bond and of the company’s revenues |
| Yield compensation | Reflects rate expectations, inflation and sovereign risk | Reflects the same factors plus a credit spread for company-specific risk |
| Typical liquidity | Often high for large, frequently traded issues | Varies widely by issuer and bond size |
Sovereign analysis also asks questions that have no corporate equivalent, such as how stable institutions are and whether a government relies heavily on foreign borrowing. For corporate issuers in the Gulf, investors often add a look at how closely a company is tied to government support or a single commodity, while treating any such link as a factor to verify rather than assume.
To see how government, corporate and other structures are built, the lessons on bond types and structures are a useful companion.
What do yield, credit spread and duration reveal about value?
Yield shows the return a bond offers at its current price, the credit spread shows the extra yield paid for taking credit risk, and duration shows how sensitive the price is to interest rate changes. Together they tell you whether a bond’s price is reasonable for the risks involved.
Yield: what you earn
Current yield is the annual coupon divided by the bond’s market price. A bond with a 5% coupon on a face value of 1,000 pays 50 a year. If its price is 950, the current yield is 50 divided by 950, which is about 5.26%. Yield to maturity goes further by counting the gain or loss from buying below or above face value and assumes the bond is held to maturity with all payments made and reinvested at that same yield. The article on bond pricing and valuation shows how to calculate it.
Credit spread: what you are paid for risk
The credit spread is a bond’s yield minus the yield of a risk-free or near risk-free benchmark of similar maturity. A wider spread means the market demands more compensation for credit and liquidity risk. A spread that widens sharply often signals that investors have become more worried about the issuer.
Duration: how much rates matter
Duration estimates how much a bond’s price changes for a small move in yields. As a rough guide, a bond with a modified duration of 6 would be expected to lose about 6% of its price if its yield rose by one percentage point, ignoring second-order effects. Longer maturities and lower coupons generally mean higher duration. The detailed guide to bond duration and interest rate risk explains how to apply it.
How do the pieces fit together in a worked example?
A worked example shows how the steps combine: check the economy, compare issuer strength, then see whether the extra yield is enough. The figures below are purely hypothetical and are provided only to illustrate the method.
Suppose two companies have similar bonds maturing in five years, and the benchmark government yield for that maturity is 4.4%.
Hypothetical comparison of two corporate bonds
| Measure | Company A | Company B |
|---|---|---|
| Debt (millions) | 1,200 | 1,800 |
| EBITDA (millions) | 400 | 300 |
| Debt to EBITDA | 3.0 times | 6.0 times |
| Interest expense (millions) | 80 | 150 |
| EBITDA to interest | 5.0 times | 2.0 times |
| Bond yield | 5.2% | 7.0% |
| Credit spread over benchmark | 0.8 percentage points | 2.6 percentage points |
Company B pays a much higher yield, but it also carries twice the leverage and far thinner interest coverage. A modest fall in earnings could put its interest payments under strain. Company A offers less income with a more comfortable cushion.
The analysis does not give a single right answer. It frames the decision: is a spread of 2.6 percentage points adequate for the extra default risk, given each company’s sector, maturity schedule and the broader economy? Investors may consider repeating this comparison with real issuer data and current market yields before drawing any conclusion.
How can investors access bonds through PhillipCapital DIFC?
PhillipCapital DIFC is a DFSA-regulated brokerage in Dubai that offers Bonds and Debentures to Retail, Professional and Institutional investors. Investors can use its research and dealing support to carry out the analysis described above on the issuers and structures that interest them.
Fundamental analysis is most useful when it feeds a clear process: define the objective, shortlist issuers by credit quality, compare yields against spreads and duration, and check how a position fits within the wider portfolio. The Bonds and Debentures page outlines the range available, and the team can explain the requirements that apply to different client categories.
Discuss bond opportunities with a regulated broker
See what is available in Bonds and Debentures and how access works for your client category
What mistakes should bond investors avoid?
The most common mistakes are chasing the highest yield without examining credit risk, relying on a rating alone, ignoring duration and overlooking liquidity. Each one comes from looking at a single number when a bond’s value depends on several.
- Chasing yield: an unusually high yield usually reflects higher risk, and the extra income can be lost if the issuer defaults.
- Relying only on ratings: ratings are a starting point and can lag changes in an issuer’s finances.
- Ignoring interest rate risk: a safe issuer does not protect a long-duration bond from price falls when yields rise.
- Overlooking call features: an issuer may be allowed to redeem a bond early, which can cap upside and force reinvestment at lower yields.
- Underestimating liquidity: some bonds trade rarely, and selling before maturity may require accepting a lower price.
- Concentrating in one issuer or sector: spreading exposure across issuers, sectors and maturities reduces the impact of a single credit event.
Good practice is straightforward: read the offering documents, compare an issuer with its peers, check how much of a position’s return comes from credit risk versus interest rate risk, and review holdings when conditions change.
Frequently Asked Questions (FAQs)
Yes, but the inputs are different. For government bonds, analysts focus on debt relative to the size of the economy, budget balance, growth, inflation and the country’s external position. These factors help judge sovereign credit risk and explain why yields differ between countries.
No single measure is enough, but leverage and interest coverage are usually the first checks. Debt to EBITDA shows the size of the debt burden, and interest coverage shows how easily earnings pay for it. Cash flow and the debt maturity schedule should then be reviewed alongside them.
No. A high rating signals a lower assessed chance of default, not protection from price changes. Bond prices still fall when market yields rise, and a downgrade can reduce the price before any payment is missed.
Credit quality should come first. Yield only has meaning once you know the risks being paid for. Once an issuer passes your credit review, comparing yield, spread and duration helps decide whether the price is attractive.
Conclusion
Fundamental analysis turns a bond from a promise on paper into a risk you can measure. Start with the economic backdrop, test the issuer’s ability to pay, read the terms of the bond, and then check whether yield, credit spread and duration add up to fair compensation. No single step is enough on its own, and each one reduces the chance of an unwelcome surprise.
Investors who follow this process are better placed to understand what they hold and why its price moves. Revisit the analysis whenever interest rates, the issuer’s results or market conditions change.
Ready to review bonds with a Dubai-based team?
Speak with PhillipCapital DIFC about your investment objectives and how bonds could fit.
Disclaimer:
Trading foreign exchange and/or contracts for difference on margin carries a high level of risk, and may not be suitable for all investors as you could sustain losses in excess of deposits. The products are intended for retail, professional and eligible counterparty clients. Before deciding to trade any products offered by PhillipCapital (DIFC) Private Limited you should carefully consider your objectives, financial situation, needs and level of experience. You should be aware of all the risks associated with trading on margin. The content of the Website must not be construed as personal advice. For retail, professional and eligible counterparty clients. Before deciding to trade any products offered by PhillipCapital (DIFC) Private Limited you should carefully consider your objectives, financial situation, needs and level of experience. You should be aware of all the risks associated with trading on margin.
Rolling Spot Contracts and CFDs are complex instruments and come with a high risk of losing money rapidly due to leverage. 78% of our retail client accounts lose money while trading with us. You should consider whether you understand how Rolling Spot Contracts and CFDs work, and whether you can afford to take the high risk of losing your money.
Basket Products
Basket Products in Structured Notes November 16, 2026 PhillipCapital DIFC...
Read MoreLeveraged Structures

Leveraged Structures in Structured Products November 11, 2026 PhillipCapital DIFC...
Read MoreInverse Floaters

Inverse Floaters Explained November 9, 2026 PhillipCapital DIFC Research Team...
Read MoreNon-Linear Payoff Structures

Non-Linear Payoff Structures October 29, 2026 PhillipCapital DIFC Research Team...
Read MoreLinear Payoff Structures

Linear Payoff Structures October 28, 2026 PhillipCapital DIFC Research Team...
Read MoreOne-Touch and No-Touch Features

One-Touch and No-Touch Features Table of Contents Introduction What Are...
Read MoreBarrier Levels and Payoff Impact

Barrier Levels and Payoff Impact Introduction Structured products often look...
Read MoreContinuous vs Discrete Observation

Continuous vs Discrete Observation Table of Contents Introduction What Does...
Read MoreBarrier Levels and Types

Barrier Levels and Types Introduction Structured products are built around...
Read MoreContingent Conversion Features

Contingent Conversion Features Introduction Structured products have evolved considerably over...
Read MoreEarly Redemption Features

Early Redemption Features Table of Contents Introduction What Is an...
Read MoreCoupon Payments in Autocalls

Coupon Payments in Autocalls Table of Contents Introduction What Is...
Read MoreObservation Dates

Observation Dates Introduction If you have ever explored structured products...
Read MoreAutocall Mechanics

Autocall Mechanics Introduction If you’ve come across the term “autocallable...
Read MoreAutocallable Structures

Autocallable Structure Table of Contents Introduction What Is an Autocallable...
Read MoreKnock-In and Knock-Out Features

Knock-In and Knock-Out Features Table of Contents Introduction What Are...
Read MoreParticipation Structures in Structured Products

Participation Structures Maximizing Market Opportunities: A Guide to Participation Structures...
Read MoreZero Capital Protection
Zero Capital Protection Understanding Zero Capital Protection: Risks, Rewards, and...
Read MoreFull Capital Protection

Full Capital Protection Understanding Full Capital Protection in Structured Products:...
Read MorePartial Capital Protection

Partial Capital Protection Partial Capital Protection: The Strategic Bridge Between...
Read MoreCapital Protection Structures

Capital Protection Structures Strategic Wealth Preservation: A Comprehensive Guide to...
Read MoreHow Structured Products Work

How Structured Products Work A Complete Guide for Investors Table...
Read MoreComponents of Structured Products

Components of Structured Products A Detailed Guide for UAE Investors...
Read MoreIntroduction to Structured Products

Introduction to Structured Products In today’s dynamic financial landscape, traditional...
Read More