
Rainbow Products Explained November 18, 2026 PhillipCapital DIFC Research Team...
Read MoreRainbow Products Explained
Rainbow Products Explained: Payoff Structures in Multi-Asset Structured Notes
Table of Contents
- What Are Rainbow Products in Structured Notes?
- How Does a Rainbow Payoff Work, Step by Step?
- What Are the Main Types of Rainbow Payoff Structures?
- How Do Best-of, Worst-of and Himalaya-Style Payoffs Compare?
- Why Does Correlation Matter So Much in Rainbow Products?
- What Do Rainbow Payoffs Look Like in Real-World Scenarios?
- What Are the Risks of Rainbow Products?
- Where Do Rainbow Products Fit in Structured Notes and Wealth Management?
- What Mistakes Should Investors Avoid, and What Are the Best Practices?
- Final Thoughts on Rainbow Products
- Common Questions About Rainbow Products
What Are Rainbow Products in Structured Notes?
A rainbow product is a structured note, or the option embedded inside it, whose payoff depends on how two or more underlying assets rank against each other. The underlying asset is the share, index, commodity or currency the note is linked to. Rank can mean the best performer, the worst performer, or a position in between.
The name comes from the idea of several assets, each a different colour, feeding into a single payoff. In derivatives terminology the building blocks are called rainbow options. A structured note typically packages a bond with one or more options of this kind, a structure explained in our structured products basics guide.
How does this differ from other multi-asset notes? A simple average basket blends every component together, so no single asset decides the result. A rainbow structure singles out assets by rank. Our guide to basket products covers the average, worst-of and best-of designs in detail, so this article concentrates on the ranking logic and the wider rainbow family around it.
Terminology varies between issuers, so the term sheet, which is the legal summary of a note’s features, always defines what a given product actually pays.
How Does a Rainbow Payoff Work, Step by Step?
A rainbow payoff is calculated in five steps: record each asset’s starting level, record its final level, convert both into a percentage performance, rank the assets, and apply the note’s formula to the asset or assets the ranking selects. Protection levels, caps and barriers then adjust the result.
The sequence below applies to most designs, although the exact dates and rules come from the term sheet.
- Fix the starting levels. On the strike date, the date when initial levels are recorded, each asset’s price or index level is noted.
- Measure the final levels. On the observation date, or on several observation dates, each asset’s level is recorded again.
- Convert to performance. Performance equals the final level divided by the initial level, minus one, shown as a percentage. This puts a high-priced index and a low-priced share on equal footing.
- Rank the assets. The assets are sorted from best to worst performance.
- Select and apply the formula. The note uses the best, worst or another ranked asset in its redemption calculation, after any cap, participation rate or barrier.
For a capital-protected note that participates in the upside of one ranked asset, redemption at maturity is generally:
Notional x [Protection level + Participation rate x the higher of 0 and the selected performance]
This formula applies only to participation-style notes that state a protection level. A coupon note with a barrier works differently: its redemption depends on whether the selected asset finished above or below the barrier, as the second scenario in the real-world scenarios section below shows. A cap, where one exists, limits the selected performance before the formula is applied.
Want to see how structured notes are assembled?
See how PhillipCapital DIFC describes structured notes, settlement terms and minimum funding.

What Are the Main Types of Rainbow Payoff Structures?
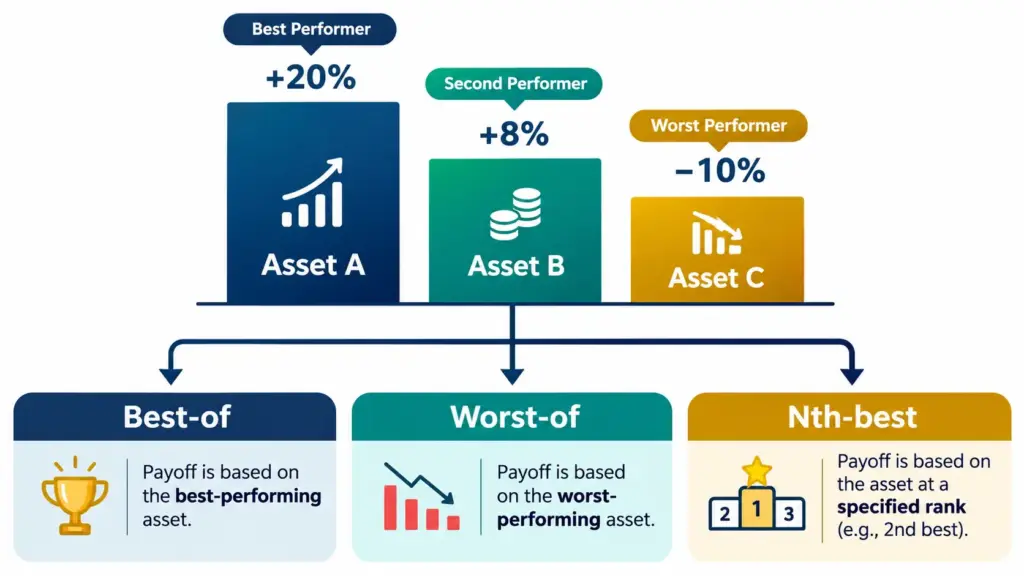
Rainbow payoffs fall into a handful of families: best-of, worst-of, nth-best, best-minus-worst spreads, and path-dependent ranked designs such as Himalaya-style notes. Each one selects a different asset or combination of assets from the group, which changes who benefits when the assets move apart.
- Best-of: The payoff follows the strongest performer in the group, so one asset doing well can lift the whole note even if the others fall.
- Worst-of: The payoff follows the weakest performer, so a single poor asset can reduce coupons or redemption even if the others do well.
- Nth-best: The payoff follows the second best, third best or another fixed rank, which creates a middle path between best-of and worst-of exposure.
- Best-minus-worst spread: The payoff depends on the gap between the best and worst performers, so it rewards assets that diverge from each other rather than assets that rise together.
- Himalaya-style ranked designs: In a common version, the best performer is recorded on each observation date and then removed from later observations, and the redemption is based on the recorded returns. Names and rules for these mountain-range structures differ by issuer, so the term sheet definition governs.
These designs sit within the wider family of non-linear payoff structures, where the payout does not move in a straight line with the underlying.
How Do Best-of, Worst-of and Himalaya-Style Payoffs Compare?
Best-of notes reward dispersion and usually offer upside, worst-of notes pay for taking on the risk of the weakest asset, and Himalaya-style notes lock in winners over time. Each reacts differently to falling correlation, which is the main reason investors compare them before choosing.
Best-of vs Worst-of vs Himalaya-Style Rainbow Payoffs
| Feature | Best-of | Worst-of | Himalaya-style |
|---|---|---|---|
| Asset that drives the payoff | The strongest performer | The weakest performer | The best performer on each observation date, removed afterwards |
| Typical investor objective | Participation in upside | Enhanced coupon or conditional return | Locking in gains over time |
| Capital position | Often capital protected, but terms vary | Usually capital at risk below a barrier | Varies by issuer, often protected |
| Effect of falling correlation | Generally increases option value, which can support better terms | Generally increases the chance that one asset falls sharply, a risk the investor takes on | Generally helpful, because larger gaps between assets give bigger winners to lock in |
| Main investor risk | Issuer credit risk and capped or partial participation | Capital loss driven by a single weak asset | Complexity and reliance on observation dates |
| Ease of understanding | Moderate | Moderate, but downside is easy to underestimate | Higher complexity |
Treat the table as a general guide. A specific note may combine features, such as a worst-of coupon with an early redemption trigger, so the term sheet remains the final reference.
Why Does Correlation Matter So Much in Rainbow Products?
Correlation measures how closely two assets move together, on a scale from minus one to plus one. In rainbow products it controls the gap between the best and worst performers, which is the gap the payoff is built around, so it strongly influences both the pricing and the outcome of a note.
When correlation is high, the assets tend to rise and fall together. The best and worst performers end up close to each other, and the ranking matters less. When correlation is low, the assets pull apart, so the best performer can finish well ahead while the worst can finish well behind.
This explains the pricing logic. Low correlation tends to make best-of upside more valuable, and it also raises the value of the downside that a worst-of investor accepts. That is why worst-of notes often advertise higher coupons than notes linked to a single asset, all else equal. The higher coupon is compensation for a bigger risk, not a free extra.
Correlation is also not fixed. It can shift over the life of a note, and assets that normally behave differently may fall together during market stress. Investors should not assume that the diversification visible in past data will hold when it is needed most.
What Do Rainbow Payoffs Look Like in Real-World Scenarios?
Two hypothetical notes show how the same three-asset group can produce very different outcomes. The first pays on the best performer with capital protection, and the second pays on the worst performer with a barrier. Both examples are illustrative only, and they ignore fees, taxes, time value and issuer credit risk.
Scenario A: A capital-protected best-of note (hypothetical)
Assume a notional of USD 100,000, three equity indices, full capital protection at maturity and a 100% participation rate with no cap. At maturity, Index A has gained 12%, Index B has fallen 5% and Index C has gained 3%.
The best performer is Index A at +12%. Redemption is 100,000 x (100% + 100% x 12%), which equals USD 112,000. If all three indices had fallen, the participation term would be zero and redemption would equal the protected USD 100,000, subject to the issuer’s ability to pay. A lower participation rate or a cap would reduce the result.
Scenario B: A non-protected worst-of note with a barrier (hypothetical)
Assume a notional of USD 100,000, three shares, a stated periodic coupon, and a barrier at 60% of each share’s initial level observed only at maturity. At maturity, Share X finishes at 110% of its initial level, Share Y at 95% and Share Z at 55%.
The worst performer is Share Z at 55%, which is below the barrier. Redemption is therefore tied to Share Z, giving USD 55,000, a 45% capital loss before counting any coupons received. Had Share Z finished at 62%, the barrier would have held and the note would have repaid the full USD 100,000 despite Share Z being down 38%. Two of the three shares rose in this example, yet the investor still lost capital, which is the central lesson of worst-of designs. Our guide to barrier features explains how barrier levels and observation methods change outcomes like this.
What Are the Risks of Rainbow Products?
The main risks of rainbow products are issuer credit risk, capital loss in worst-of designs, correlation shifts, complexity, limited upside, and limited secondary market liquidity. Because the payoff depends on several assets at once, these risks can combine in ways that are harder to see than in a single-asset note.
- Issuer credit risk: A structured note is a debt obligation of its issuer, so even a capital-protected rainbow note depends on the issuer being able to repay.
- Capital loss in worst-of designs: If the weakest asset breaches a barrier or finishes below the reference level, redemption can fall well below the amount invested.
- Correlation risk: If assets that were expected to diversify each other fall together, a worst-of note can suffer losses sooner than its pricing implied.
- Complexity and valuation: Ranking rules, observation dates and removal mechanics make these notes harder to value, so the price in the secondary market may differ from what an investor expects.
- Limited upside: Caps, partial participation rates or early redemption features can reduce gains even when the selected asset performs strongly.
- Liquidity risk: Selling before maturity depends on a secondary market that may be limited, and the exit price can be lower than the amount invested.
- Currency risk: If the underlying assets are priced in different currencies, exchange rate movements can influence performance unless the note removes that effect.
Regulators have drawn attention to this area. The US Securities and Exchange Commission has published an investor bulletin on structured notes that outlines their features and risks, and in May 2026 FINRA announced a review of higher-risk structured products, including non-principal-protected worst-of notes. Both are US bodies and do not govern clients in the DIFC, but they show where regulatory attention on complexity is focused.
Where Do Rainbow Products Fit in Structured Notes and Wealth Management?
Rainbow payoffs are a feature set within structured notes, used to shape upside, income or protection across several assets. At PhillipCapital DIFC, structured notes are handled within the wealth management offering. Availability, terms and eligibility depend on the issuer, the specific note and the investor’s categorisation.
Within portfolio construction, investors may consider what job a rainbow note is meant to do. A capital-protected best-of structure aims at participation with a defined floor, while a worst-of coupon structure aims at income in exchange for accepting capital risk. These are different trade-offs, and our overview of capital protection and other structured product types shows how protection levels change the risk and return profile.
Risk profiling is the starting point. Investors should evaluate their time horizon, loss tolerance and existing holdings before looking at any multi-asset note, and the wealth management and structured notes page describes the services available.
Have questions about a specific structured note?
Our team can walk you through how structured notes work and what to review in a term sheet.
What Mistakes Should Investors Avoid, and What Are the Best Practices?
The most common mistakes are focusing on the headline coupon, ignoring the weakest asset, assuming protection is automatic, and skipping the term sheet. Good practice is to read the term sheet line by line and test the note against several market scenarios before committing.
Common mistakes include:
- Judging a worst-of note by its coupon alone, without checking how much capital is at risk if one asset falls.
- Assuming that a best-of note is capital protected, when protection is a separate feature that must be stated.
- Choosing assets that look diversified on paper but tend to fall together in stressed markets.
- Overlooking early redemption or issuer call features that can end the note before the upside appears.
Before investing, investors should evaluate these items in the term sheet:
- The list of underlying assets and how performance is measured for each.
- The initial levels, observation dates and whether observation is at maturity only or on several dates.
- The protection level, barrier level, participation rate and any cap.
- The issuer, its credit standing and the currency of the note.
- Fees, costs and what the secondary market may offer before maturity.
Final Thoughts on Rainbow Products
Rainbow products turn a group of assets into a ranked contest, and the note pays according to who wins or who loses. Best-of structures point toward upside, worst-of structures trade income for risk, and ranked designs such as Himalaya notes lock in gains over time. The ranking rule, the protection terms and correlation together decide the outcome.
Investors who understand these three pieces are better placed to compare notes sensibly and to read a term sheet with confidence. For the wider foundations, our structured products basics guide is a good place to continue.
Frequently Asked Questions (FAQs)
No. A basket option blends several assets into one combined value, while a rainbow option selects assets by their rank. The difference matters because an average smooths out extremes, whereas a rainbow payoff is driven by the best, worst or another specific position.
Not necessarily. Some rainbow notes include a stated protection level, while others, particularly worst-of coupon notes, put capital at risk below a barrier. Even protected notes depend on the issuer’s ability to repay, so the term sheet should always be checked.
Pricing generally depends on the volatility of each asset and the correlations between them. For many multi-asset designs, issuers use simulation methods rather than a simple formula, which is one reason secondary market prices can be hard for investors to verify.
Sometimes. Early redemption depends on features written into the note, such as issuer call rights or automatic triggers linked to asset levels. Notes without such features run to maturity, and selling earlier relies on a secondary market that may be limited.
Ready to explore structured investing with a regulated broker?
Discover the range of products available through PhillipCapital DIFC, a DFSA-regulated brokerage in Dubai.
Disclaimer:
Trading foreign exchange and/or contracts for difference on margin carries a high level of risk, and may not be suitable for all investors as you could sustain losses in excess of deposits. The products are intended for retail, professional and eligible counterparty clients. Before deciding to trade any products offered by PhillipCapital (DIFC) Private Limited you should carefully consider your objectives, financial situation, needs and level of experience. You should be aware of all the risks associated with trading on margin. The content of the Website must not be construed as personal advice. For retail, professional and eligible counterparty clients. Before deciding to trade any products offered by PhillipCapital (DIFC) Private Limited you should carefully consider your objectives, financial situation, needs and level of experience. You should be aware of all the risks associated with trading on margin.
Rolling Spot Contracts and CFDs are complex instruments and come with a high risk of losing money rapidly due to leverage. 78% of our retail client accounts lose money while trading with us. You should consider whether you understand how Rolling Spot Contracts and CFDs work, and whether you can afford to take the high risk of losing your money.
Basket Products
Basket Products in Structured Notes November 16, 2026 PhillipCapital DIFC...
Read MoreLeveraged Structures

Leveraged Structures in Structured Products November 11, 2026 PhillipCapital DIFC...
Read MoreInverse Floaters

Inverse Floaters Explained November 9, 2026 PhillipCapital DIFC Research Team...
Read MoreNon-Linear Payoff Structures

Non-Linear Payoff Structures October 29, 2026 PhillipCapital DIFC Research Team...
Read MoreLinear Payoff Structures

Linear Payoff Structures October 28, 2026 PhillipCapital DIFC Research Team...
Read MoreOne-Touch and No-Touch Features

One-Touch and No-Touch Features Table of Contents Introduction What Are...
Read MoreBarrier Levels and Payoff Impact

Barrier Levels and Payoff Impact Introduction Structured products often look...
Read MoreContinuous vs Discrete Observation

Continuous vs Discrete Observation Table of Contents Introduction What Does...
Read MoreBarrier Levels and Types

Barrier Levels and Types Introduction Structured products are built around...
Read MoreContingent Conversion Features

Contingent Conversion Features Introduction Structured products have evolved considerably over...
Read MoreEarly Redemption Features

Early Redemption Features Table of Contents Introduction What Is an...
Read MoreCoupon Payments in Autocalls

Coupon Payments in Autocalls Table of Contents Introduction What Is...
Read MoreObservation Dates

Observation Dates Introduction If you have ever explored structured products...
Read MoreAutocall Mechanics

Autocall Mechanics Introduction If you’ve come across the term “autocallable...
Read MoreAutocallable Structures

Autocallable Structure Table of Contents Introduction What Is an Autocallable...
Read MoreKnock-In and Knock-Out Features

Knock-In and Knock-Out Features Table of Contents Introduction What Are...
Read MoreParticipation Structures in Structured Products

Participation Structures Maximizing Market Opportunities: A Guide to Participation Structures...
Read MoreZero Capital Protection
Zero Capital Protection Understanding Zero Capital Protection: Risks, Rewards, and...
Read MoreFull Capital Protection

Full Capital Protection Understanding Full Capital Protection in Structured Products:...
Read MorePartial Capital Protection

Partial Capital Protection Partial Capital Protection: The Strategic Bridge Between...
Read MoreCapital Protection Structures

Capital Protection Structures Strategic Wealth Preservation: A Comprehensive Guide to...
Read MoreHow Structured Products Work

How Structured Products Work A Complete Guide for Investors Table...
Read MoreComponents of Structured Products
Components of Structured Products A Detailed Guide for UAE Investors...
Read MoreIntroduction to Structured Products

Introduction to Structured Products In today’s dynamic financial landscape, traditional...
Read More